Fig. S3.
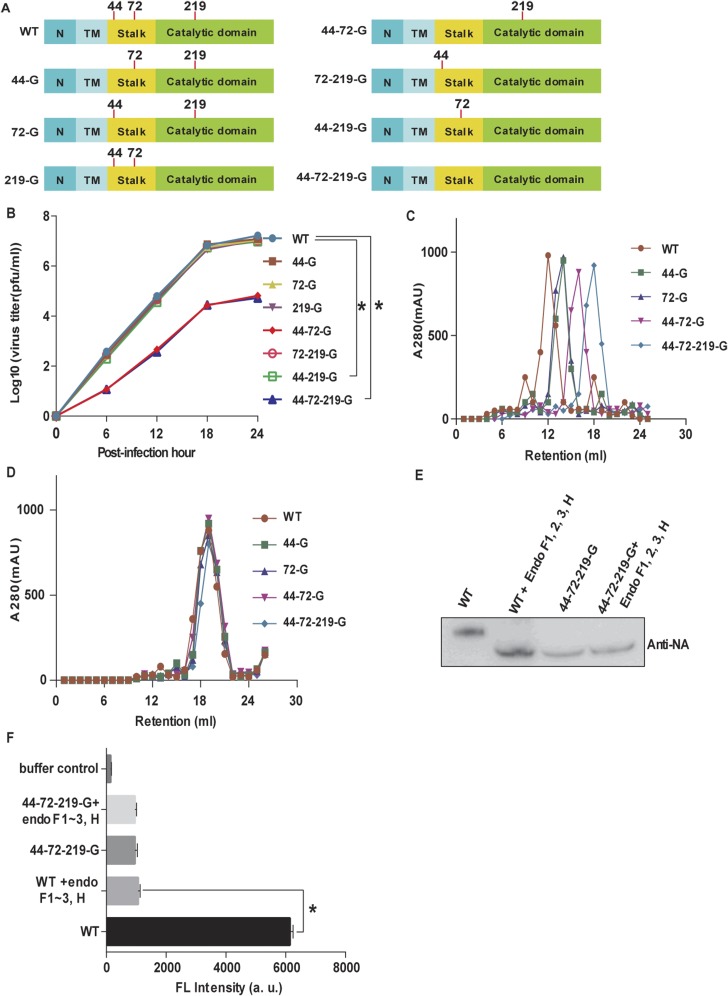
NA glycosylation and IAV. (A) Schematic overviews of eight IAVs with different glycosylation patterns on NA. Red lines, glycosite; N, N-terminal cytoplasmic domain; TM, transmembrane domain. All recombinant viruses were confirmed by genome sequencing. (B) Comparison of virus production in MDCK cells infected with eight variants of virus as indicated. Mean ± SEM for three independent experiments. (C) Gel filtration analysis of five types of NA proteins. (D) Gel filtration analysis of five types of deglycosylated NA proteins. (E) Western blot analysis of viruses after treatment with the endoglycosidase mixture. The filter was probed with anti-NA antibody. (F) Measurements of the NA activity of deglycosylated IAV by 4-MUNANA assay. Mean ± SEM for five independent experiments. *P < 0.001.

