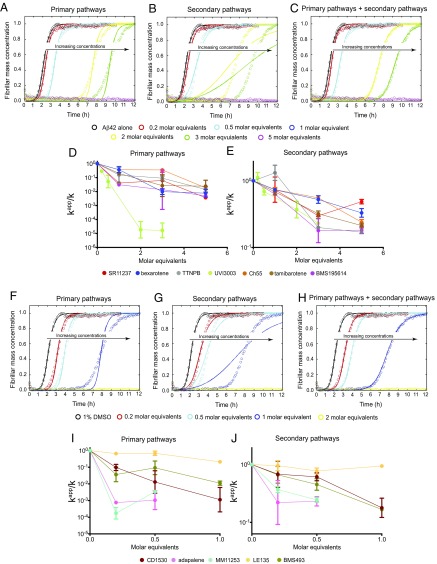
Fig. 3.
Characterization of the effects of set A and set B molecules on Aβ42 aggregation using quantitative chemical kinetics. (A–C) Kinetic profiles of the aggregation of 2 μM Aβ42 in the absence and presence of either 1% DMSO (black) or 0.2 (red), 0.5 (cyan), 1 (blue), 2 (yellow), 3 (green), or 5 (magenta) M eq of UVI3003, a representative molecule of set A. The solid lines show predictions for the resulting reaction profiles when primary pathways (A, knk+), secondary pathways (B, k2k+), or both pathways (C) are inhibited by UVI3003. The abbreviation kn is the rate of primary nucleation, k+ is the rate of elongation, and k2 is the rate of secondary nucleation. Only predictions when both pathways are inhibited fit the experimental data well. The dependence of the apparent reaction rate constants (kapp) of primary pathways (D, knk+), and secondary pathways (E, k2k+), as derived from Fig. S4, is shown with increasing concentrations of small-molecule inhibitors. In each case, k represents either knk+ (primary pathways) or k2k+ (secondary pathways). (F–H) Kinetic profiles of the aggregation of a 2 μM Aβ42 solution in the absence and presence of either 1% DMSO (black) or 0.2 (red), 0.5 (cyan), 1 (blue), or 2 (yellow) M eq of CD1530, a representative molecule of set B. The solid lines show predictions for the resulting reaction profiles when primary pathways (F, knk+), secondary pathways (G, k2k+), or both pathways (H) are inhibited by CD1530. Only predictions when both pathways are inhibited fit the experimental data well. Dependences of the apparent reaction rate constants of primary pathways (I, knk+) and secondary pathways (J, k2k+), as derived from Fig. S5, is shown with increasing concentrations of small-molecule inhibitors.

