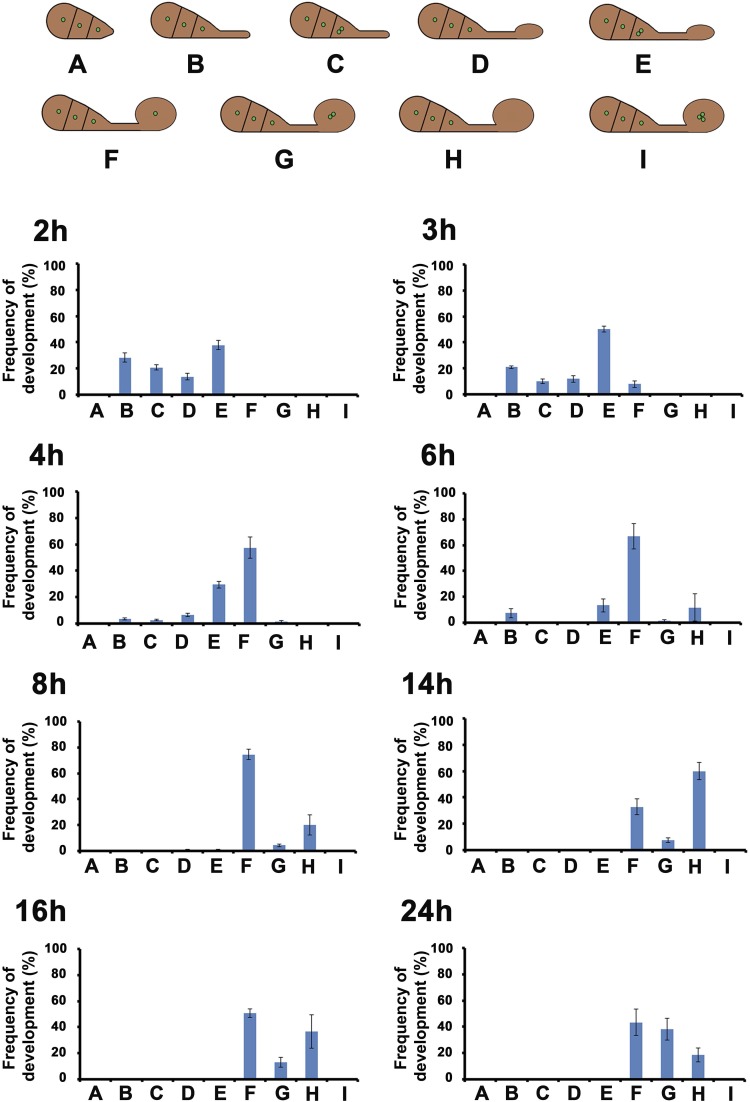
Fig. S1.
Cell-cycle progression during appressorium development shown by GFP–LacI–NLS coexpressed with 256 repeats of LacO. (Upper) Diagram to show the stages of development during appressorium formation. Green dot depicts the fluorescence punctum resulting from GFP–LacI–NLS coexpressed with 256 repeats of LacO. One dot indicates the prereplicative stage (G1), and two dots indicate the postreplicative stage (S/G2). (Lower) Bar chart to show the frequency of developmental stages for each time point. Error bars represent the SD from three independent replicates of the experiment.

