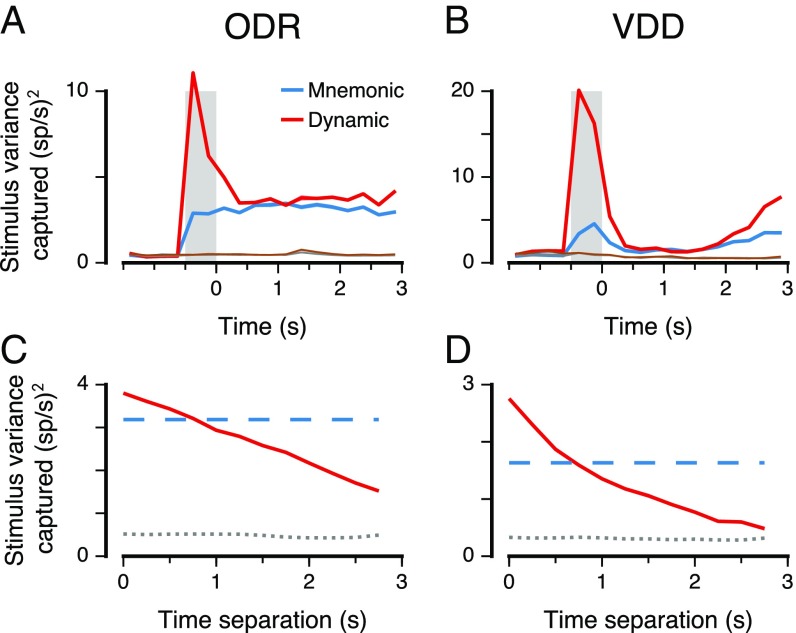
Fig. 3.
Stimulus variance captured by the mnemonic and dynamic coding subspaces. The mnemonic subspace is defined using delay activity as in Fig. 2. The dynamic subspace is defined from data for each timepoint (0.25 s). The dimensionality of the subspaces is 2 for ODR (A and C) and 1 for VDD (B and D), matching the dimensionality of the stimulus feature for each task. (A and B) Stimulus variance captured for stable mnemonic subspace (blue) and for a dynamic subspace optimized for each timepoint (red). Chance values for the stable (gray) and dynamic (brown) subspaces were calculated by shuffling stimulus trial labels. (C and D) Generalizability of the dynamic subspace across time. The red curve marks the stimulus variance captured by the dynamic subspace defined at one time for activity at another time separated by a given time separation, averaged across timepoints during the delay. The blue dashed line marks the stimulus variance captured by the mnemonic subspace, averaged across the delay epoch. The gray dotted line marks the mean chance level during the delay. Shaded bands mark SEM.

