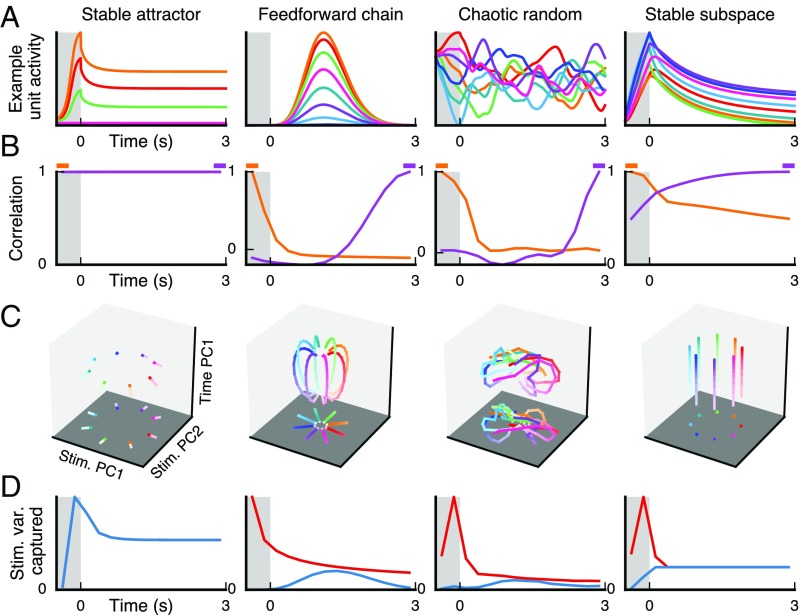
Fig. 5.
Population-level analyses measures distinguish theoretical model network mechanisms for population coding and dynamics. We tested four dynamical circuit models, described in the main text: stable attractor, feedforward chain, chaotic random, and stable subspace. The simulated stimulus features are designed to match the ODR task. (A) Example activity for one neural unit in the network. Each colored trace indicates a different stimulus condition, as for ODR. (B) Correlation of population state as a function of time, as in Fig. 1 C and D. We show the correlation for each timepoint with the sensory (orange) and late memory (purple) states. (C) Delay-activity state–space trajectories, as in Fig. 2 C and D. (D) Stimulus variance captured over time, for mnemonic (blue) and dynamic (red) coding subspaces, as in Fig. 3 A and B.

