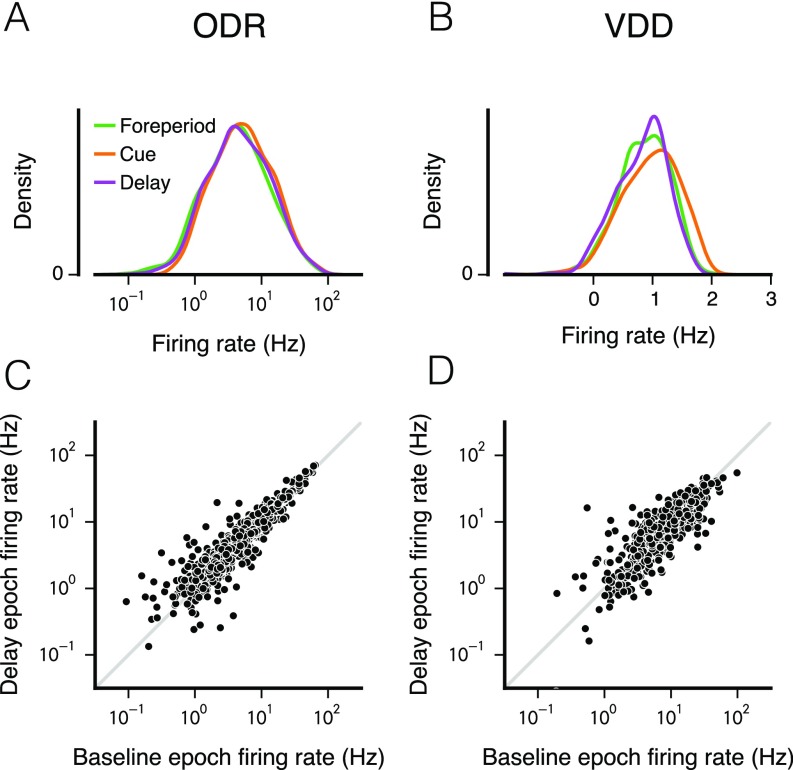
Fig. S2.
Distribution of mean firing rates across neurons in different task epochs. (A and B) Firing-rate distributions plotted in a lin-log plot, with logarithmic x axis and linear y axis. The observed distribution of firing rates is approximately a log-normal distribution. Interestingly, when compared across task epochs (foreperiod, cue, working memory delay), the overall distribution of firing rates does not change substantially. In particular, the distribution during the delay epoch is essentially the same as during the foreperiod. (C and D) Correlation across neurons of mean firing rates between task epochs. Shown here are the correlations between delay epoch and the foreperiod epoch. The values of the Pearson’s r correlation coefficient of the log-transformed firing rates are the following: For ODR, 0.88 for foreperiod–cue, 0.91 for foreperiod–delay, and 0.89 for cue–delay; for VDD, 0.75 for foreperiod–cue, 0.83 for foreperiod–delay, and 0.66 for cue–delay.

