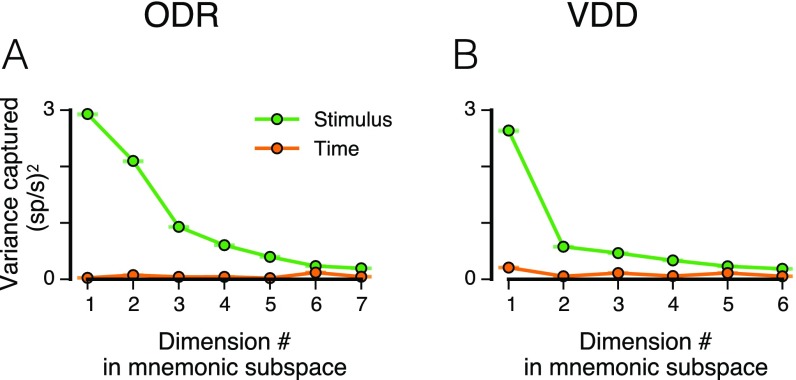
Fig. S4.
Stimulus- and time-related variance of delay activity captured by the mnemonic subspace, for each dimension in the mnemonic subspace. (A and B) The green points show the variance (per neuron), across stimuli, for the time-averaged mean delay activity, i.e., . The orange points show the average within-stimulus, time-related variance (per neuron) of the trajectory (using 0.25-s time bins), i.e., . The orange points may overestimate the true time-related variance, as variance will be contributed by noisy estimation of the PSTH due to finite numbers of trials. Error bars denote the 95% range generated by leave-one-neuron-out jackknife resampling, characterizing how much these estimates would change if additional neurons were included.

