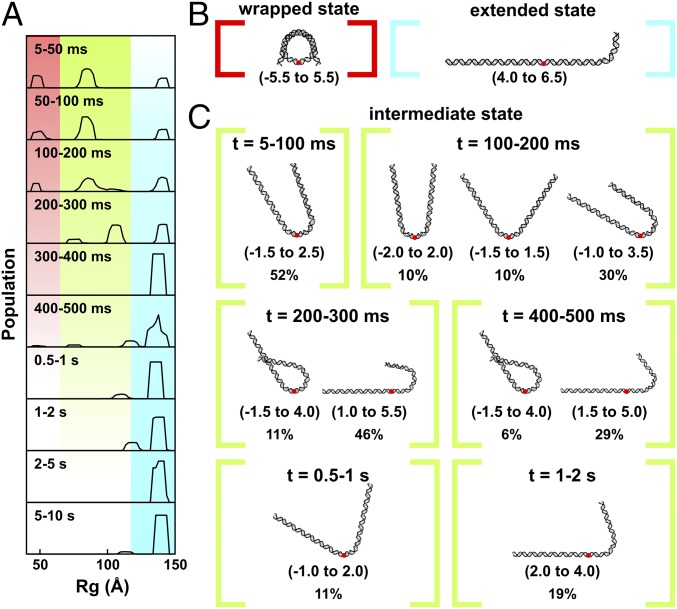
Fig. 4.
DNA structures selected by EOM analysis of TR-SAXS data for NCPs dissociated in 1.9 M NaCl and 50% sucrose. (A) Rg(t) histograms for DNA structural models selected by EOM. Regions highlighted in red, green, and blue correspond with the fully wrapped, intermediate, and extended states, respectively. (B) Models that best represent the measured SAXS profile for the initial wrapped state (red) and final extended state (blue). (C) Models that best represent the intermediate states as a function of time. Red dots indicate the dyad axis or superhelical location zero (SHL 0). Numbers in the parentheses reveal the range of SHLs (number of turns where the major groove faces the histone, every 10 bp) contained within the curved portions. Percentages show the weights of the species out of the total population at the indicated time point. Under high-salt conditions where complete dissociation of 601-NCPs is favored, multiple partially unwrapped intermediates are populated.

