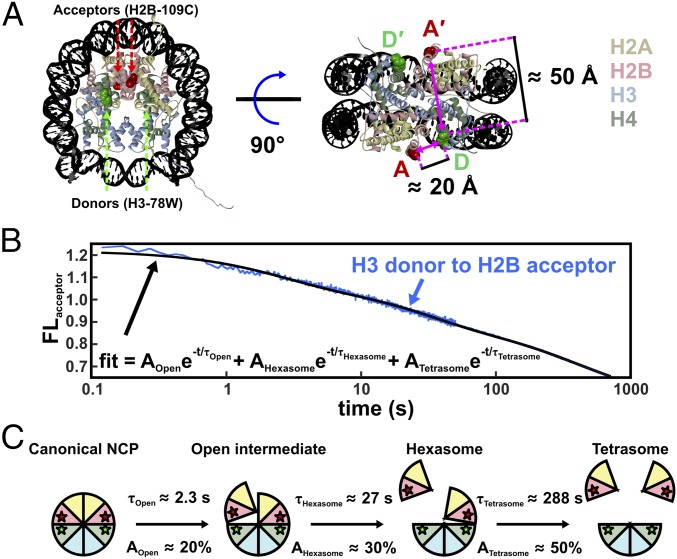
Fig. 6.
NCP FRET pairs and the histone configurations observed. (A) FRET pairs with H3-78W donor (green) and H2B-109CysAEDANS acceptor (red). For this construct (H3–H2B NCP), the donor and acceptor on the same face of the NCP (D–A) are close to the Förster radius for this FRET pair (∼20 Å), but the distance from the donor to the acceptor on the other NCP face (D–A′) is significantly longer (∼50 Å) and should contribute less than 1% to the observed FRET signal. The Cβ positions in the 1AOI.pdb structure of the NCP were used to estimate distances between the FRET pairs. (B) Acceptor fluorescence time course measured for 250 nM NCP in 1.2 M NaCl (blue). The solid black line represents a sum of three first-order exponentials used to determine the relative amplitudes and relaxation times. To obtain robust values, global fits were used on datasets collected as a function of NCP concentration (10–250 nM NCP). (C) Histone configurations observed with TR-FRET. Relaxation times (τ) and amplitudes (A) of FRET loss measured at 1.2 M NaCl are reported for each transition.

