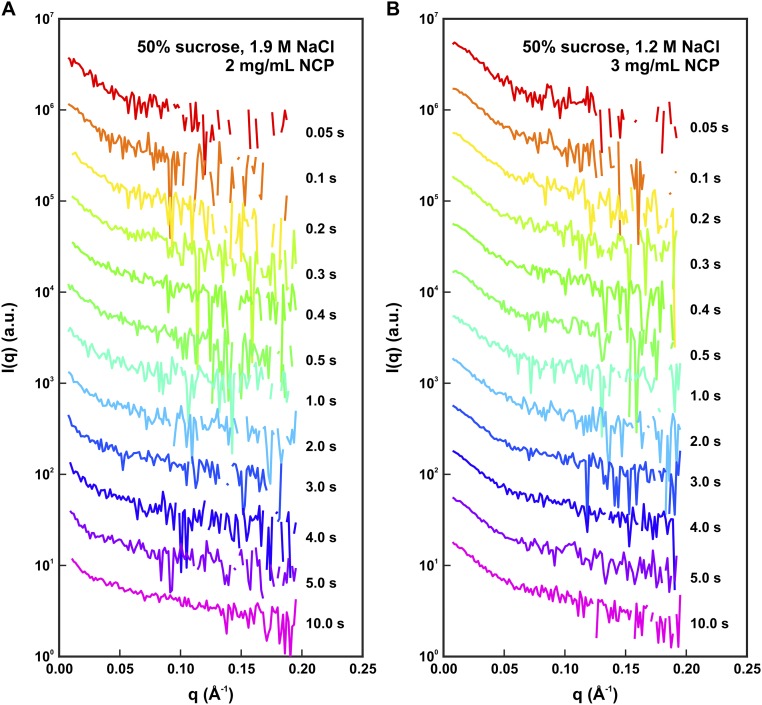
Fig. S1.
Time-resolved SAXS profiles for NCPs destabilized by NaCl in 50% sucrose. (A and B) Time course measured for NCPs in 1.9 M NaCl (A) and 1.2 M NaCl (B). SAXS profiles for the time points after 0.5 s were collected using an attenuated X-ray beam to reduce the effects of radiation damage. Similar signal-to-noise ratios were achieved for the data collected within each salt series by using longer time bins (1 s) for the time points collected with the attenuator (for details, see Materials and Methods). SAXS profiles were offset for enhanced visualization and negative values are not shown on the log plot.

