Fig. S2.
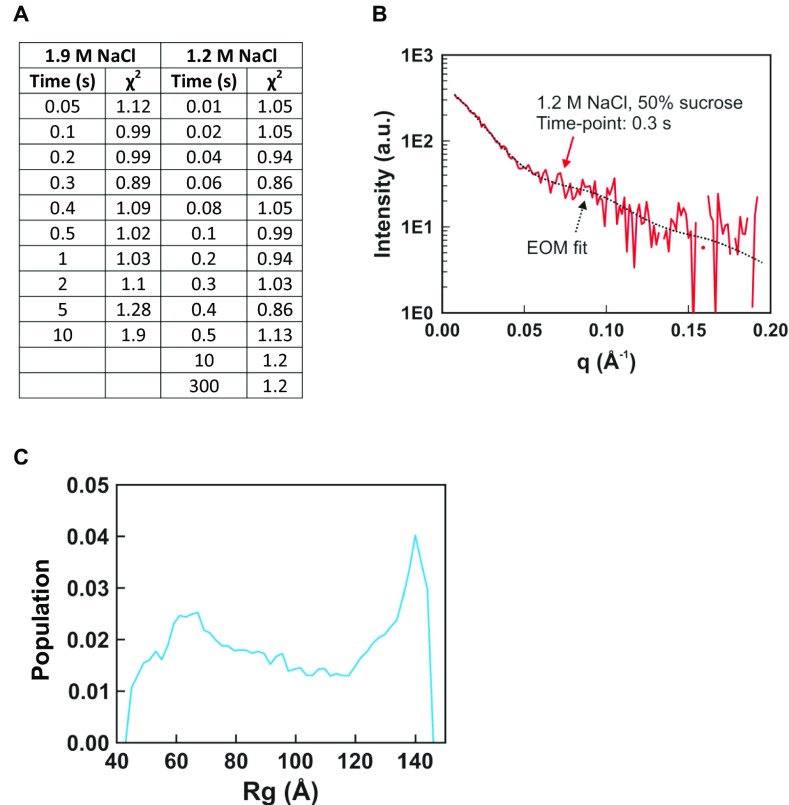
Ensemble optimization method (EOM) analysis of TR-SAXS data. (A) Table of χ2 values for EOM fits to TR-SAXS data. (B) Representative fit of SAXS profile calculated for the ensemble of structures selected by EOM that best recapitulate the measured TR-SAXS profile. (C) Histogram of radius of gyration (Rg) values for the DNA pool (9,182 structures) used for EOM analysis. The Rg histograms for the time course of selected ensembles are shown in Figs. 4A and 5A. The pool of DNA structures used in this study was sufficiently large enough to create ensembles of structures that fit the data well.

