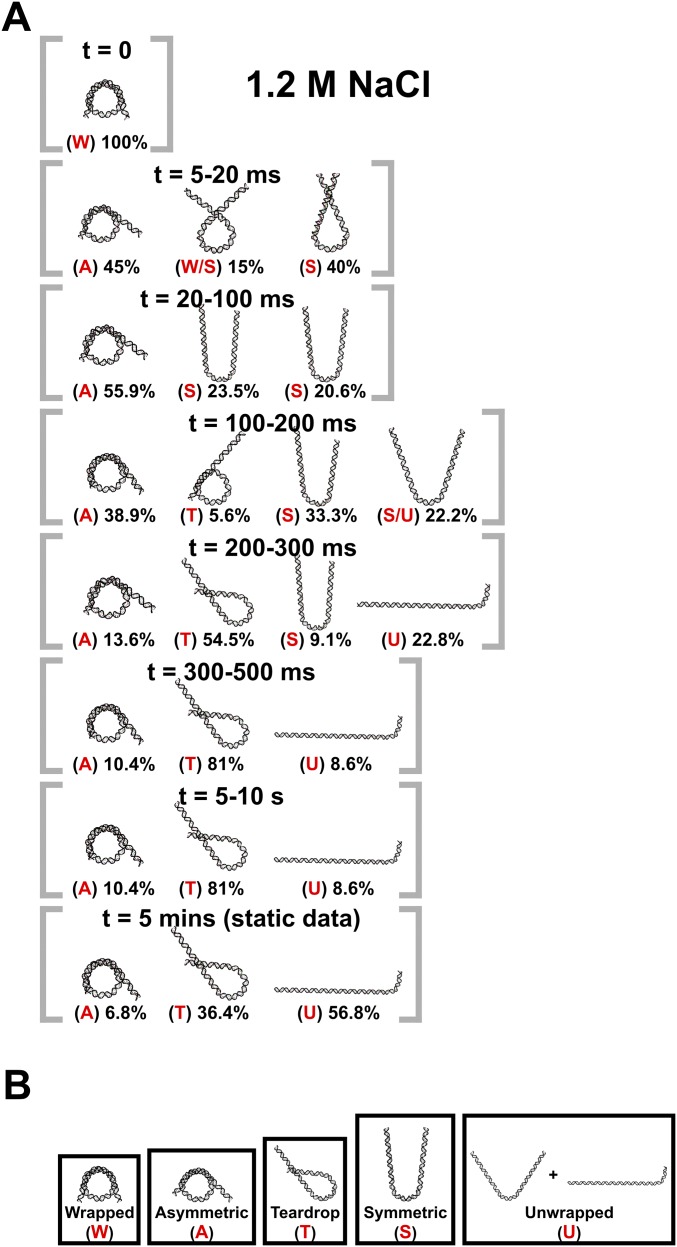
Fig. S3.
Ensembles of DNA structures selected by EOM. (A) DNA structures selected for NCPs in 1.2 M NaCl as a function of time. Percentages shown are the weights of the species out of the total population at the indicated time point. (B) Generalized classes of DNA conformations into which the models selected by EOM were grouped. The red letters for each model in A designate how the structures were grouped for subsequent analysis. Multiple letters mean that the population weight was split between the reported classes.

