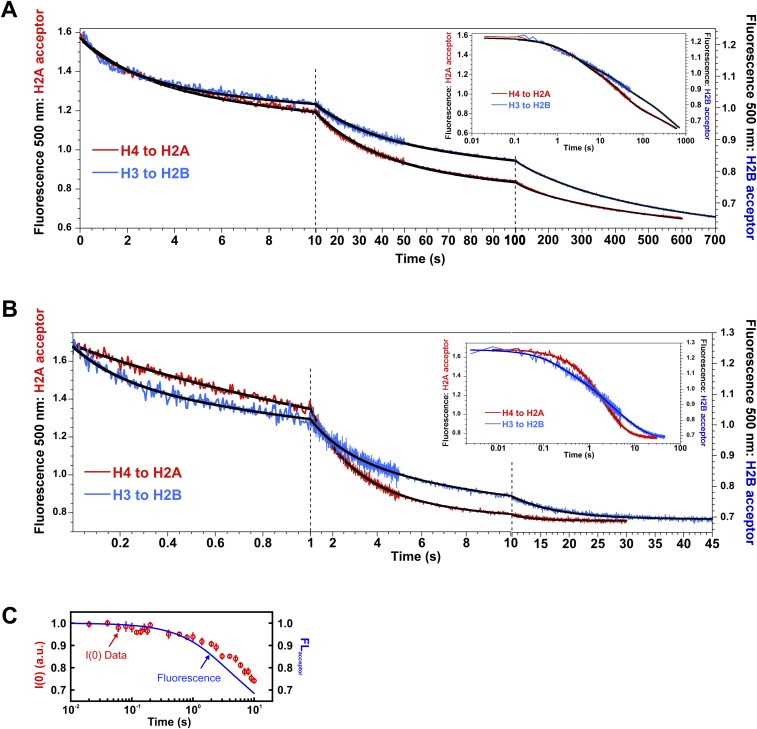
Fig. S6.
Representative FRET responses for NCPs destabilized by NaCl. (A) Acceptor fluorescence time course measured for NCPs in 1.2 M NaCl. Each dataset (averaged over 20 kinetic measurements) shows the decrease in acceptor fluorescence after initiation of the salt jump for each FRET construct used. The final NCP concentration was 250 nM NCP. (B) Same as A, except NCPs were measured in 1.9 M NaCl. The solid black lines represent the global fits to a sum of three first-order exponentials for datasets collected as a function of NCP concentration (10–250 nM NCP). The relaxation times and relative amplitudes derived from these fits are reported in Table 1. Insets in A and B are log scale presentations of time courses. (C) Comparison of relative TR-FRET changes with I(0,t) measured using TR-SAXS for NCPs in 0% sucrose and 1.2 M NaCl. The dynamics measured on overlapping timescales agree well between SAXS and FRET.

