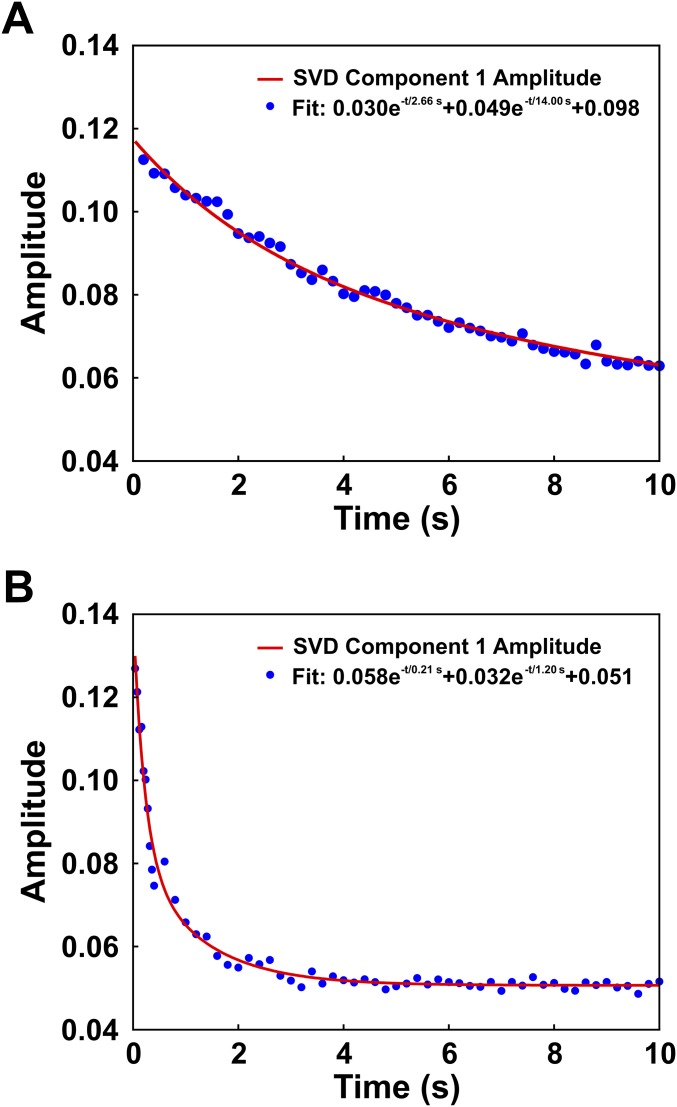
Fig. S8.
Determination of relaxation times using singular value decomposition (SVD) analysis of the full time course of SAXS profiles. The time-dependent amplitude of the first component is shown for NCPs measured in 0% sucrose and 1.2 M NaCl (A) and 1.9 M NaCl (B). The amplitude dynamics of the first component represents the largest changes observed in the SAXS profiles. These changes correspond with NCP disassembly and reflect both conformational changes as well as changes in molecular mass [changes in the forward scattering, I(0)]. The decreasing amplitudes were fit to sums of exponential decays as shown. The relaxation times observed here are remarkably consistent with the values determined from FRET as shown in Table 1.

