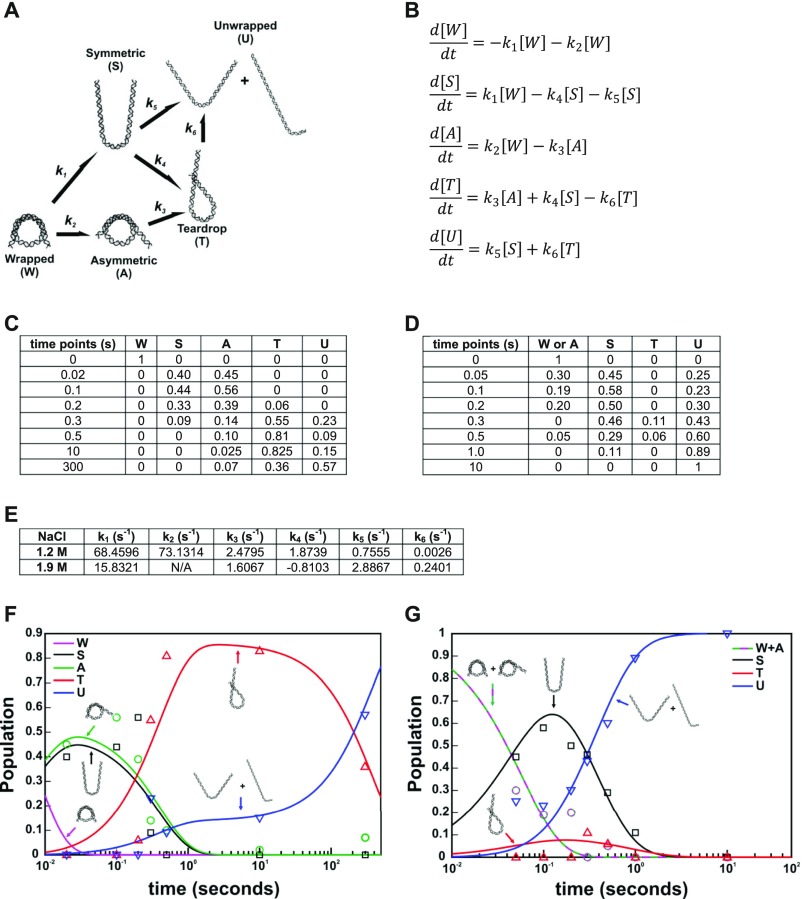
Fig. S9.
Calculation of kinetic rates from structures selected by EOM. (A) Kinetic scheme with pathways inferred from prominent DNA structures selected by EOM analysis for NCP data collected in 50% sucrose and 1.2 M NaCl (DNA structures selected at 1.9 M NaCl were nearly identical). (B) Kinetic equations describing the population dynamics for the kinetic scheme in A. (C) Time course of DNA structure populations determined from EOM analysis for NCP data collected with 50% sucrose and 1.2 M NaCl. (D) Same as C, except using results for 1.9 M NaCl. (E) Rates for the kinetic scheme in A determined by solving the kinetic equations in B using population data for NCPs in 1.2 M (C) and 1.9 M (D) NaCl. Note: Convergent solutions were achieved using the same kinetic scheme for both datasets, suggesting that the overall structures through which DNA unwraps are similar at both salt concentrations. However, the rates determined are quite different between these two conditions and indicate that not only is unwrapping faster at higher salt, but different pathways are preferred depending on [NaCl]. The opposite sign of k4 at 1.9 M NaCl suggests that the symmetric unwrapped DNA is preferred over the teardrop at the more destabilizing condition. (F) Population data in C plotted with the simulated populations (lines) determined from the solved kinetic equations for 1.2 M NaCl (E). (G) Same as F, except using results for 1.9 M NaCl (D and E). Note: the asymmetrically unwrapped DNA state (A) was not observed sufficiently enough in 1.9 M NaCl to be reliably fit; thus it was not included in the fitting and k2 and k3 are linked together.

