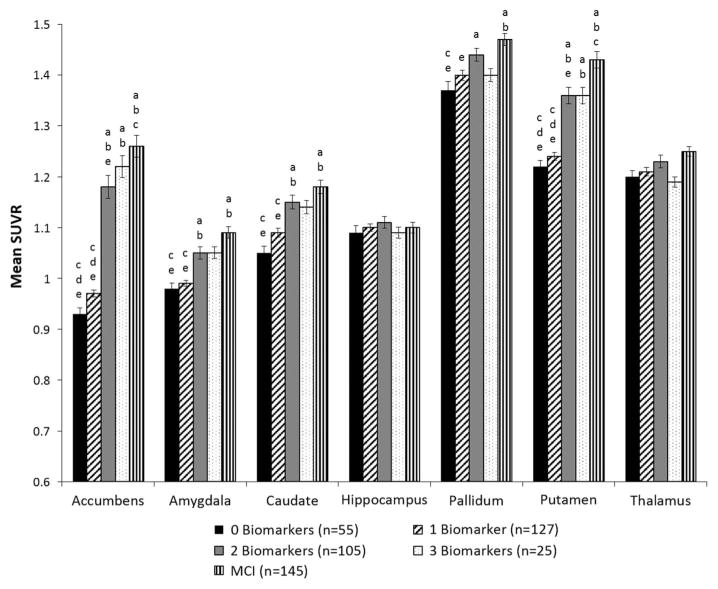
Fig. 3.
Mean standard uptake ratio (SUVR) for allocortical/subcortical regions in preclinical AD stages (based on number of abnormal biomarkers) and MCI. Error bars denote standard error of the mean. Letters denote significant group differences: a = different than 0 Biomarkers; b = different than 1 Biomarker; c = different than 2 Biomarkers; d = different than 3 Biomarkers; e = different than MCI.

