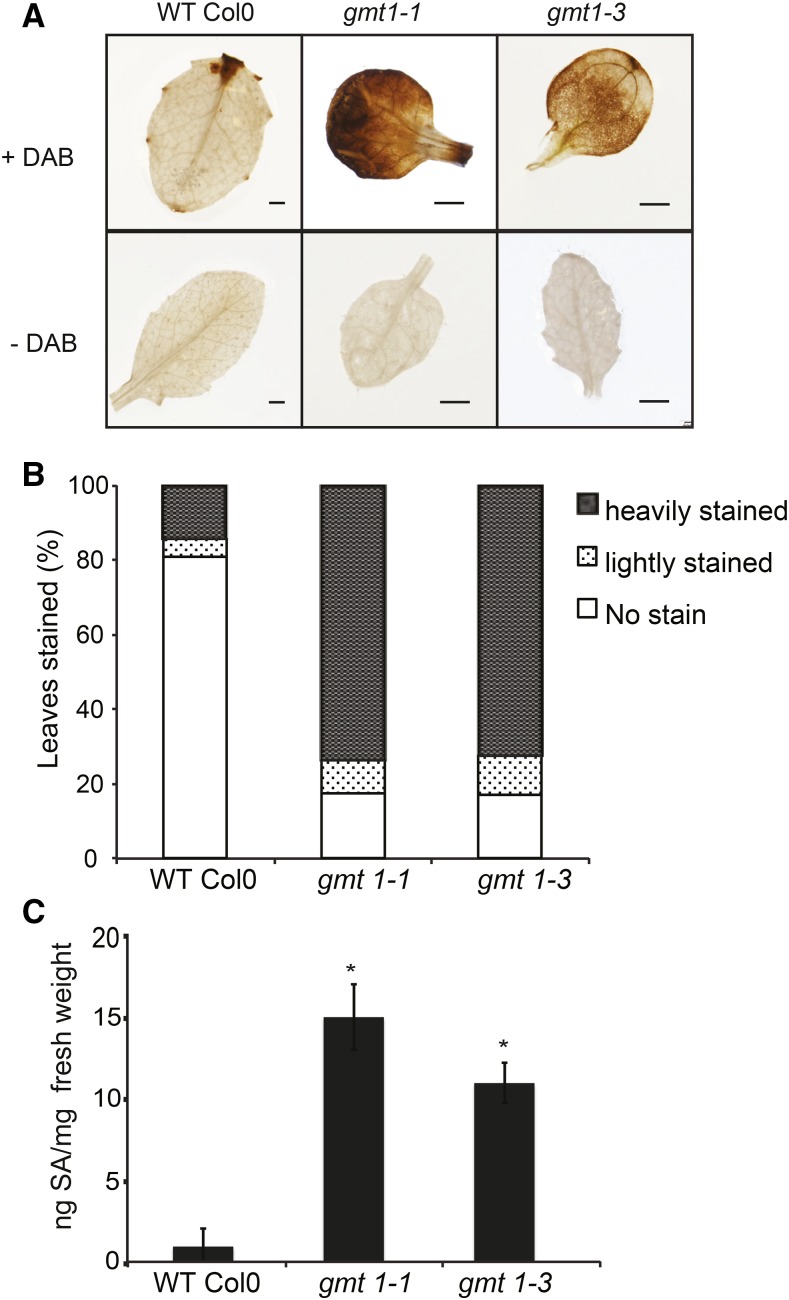
Figure 6.
H2O2 and SA in gmt1 Leaves.
(A) H2O2 detection in 15-d-old, agar-grown leaves by DAB staining. Bar = 1 mm.
(B) Percentage and extent of leaves stained by DAB (n = 21 to 34 individual plants).
(C) Total SA content of 15-d-old, agar-grown leaves; n = 3, ±sd. An asterisk indicates a significant difference from the wild type (Student’s t test, P < 0.01).

