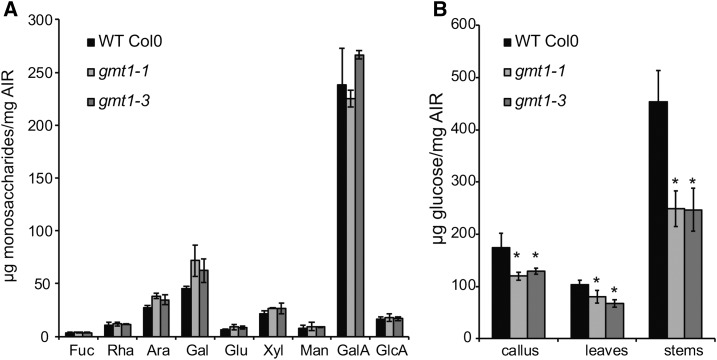
Figure 7.
Cell Wall Composition Analysis.
(A) Monosaccharide analysis of wild-type and gmt1 leaves; n = 3, ±sd. Destarched AIR was hydrolyzed with 2 M TFA, and the released monosaccharides were quantified by HPAEC-PAD.
(B) Crystalline cellulose content of gmt1 callus, leaves, and stems. Following sulfuric acid hydrolysis of the TFA-insoluble fraction of AIR, the Glc released was quantified by HPAEC-PAD; n = 3; ±sd. An asterisk indicates a significant difference from the wild type (Student’s t test, P < 0.01).

