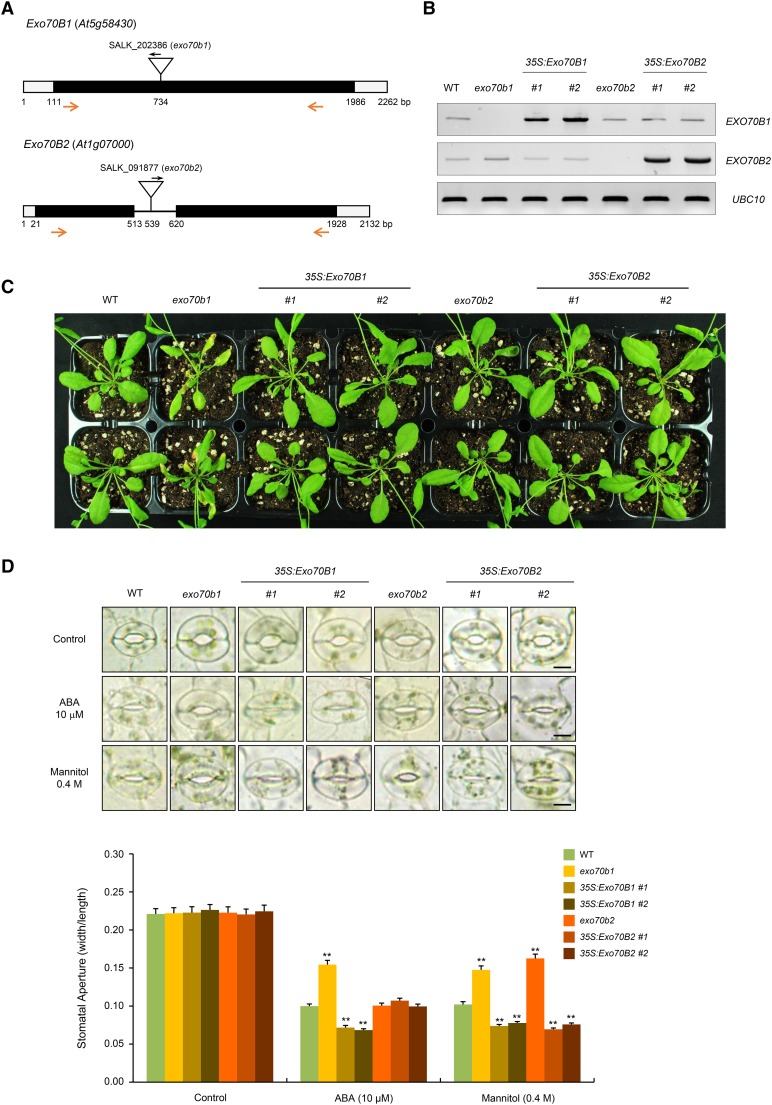
Figure 7.
Exo70B1 and Exo70B2 Are Positive Regulators of the Response to Mannitol Treatments in ABA-Dependent and ABA-Independent Manners, Respectively
(A) Schematic structure of exo70b1 and exo70b2 T-DNA inserted loss-of-function mutant alleles. Inverted triangles indicate T-DNA insertion sites. Black bars, open bars, and solid line represent coding regions, untranslated regions, and intron, respectively. Gene-specific and T-DNA-specific primers used in RT-PCR are shown with arrows.
(B) RT-PCR analysis to detect the transcript levels of Exo70B1 and Exo70B2 in wild-type, exo70b1, 35S:Exo70B1 (transgenic lines #1 and #2), exo70b2, and 35S:Exo70B2 (transgenic lines #1 and #2) plants. Each experiment was performed with three independent biological replicates. UBC10 was used as a loading control.
(C) Phenotypes of wild-type, exo70b1, 35S:Exo70B1, exo70b2, and 35S:Exo70B2 plants under normal growth conditions. Seedlings were grown in half-strength Murashige and Skoog medium containing 1% sucrose and 0.7% phytoagar (pH 5.7) for 9 d, transferred to soil, and grown for 4 weeks in a growth chamber at 22°C under long-day conditions (16 h light/8 h darkness).
(D) ABA- and mannitol-induced stomatal closure in wild-type, exo70b1, 35S:Exo70B1 (transgenic lines #1 and #2), exo70b2, and 35S:Exo70B2 (transgenic lines #1 and #2) plants. Light-grown mature rosette leaves were immersed in stomatal opening solution for 2 h and transferred to solution that contained 10 μM ABA or 0.4 M mannitol for 2 h. Stomata were captured using bright-field microscopy. At least 30 stomatal apertures in each epidermal strip were measured per replicate. Three replicates were performed for each experiment. Error bars represent ±se (n = 90, **P < 0.005, one-way ANOVA). Bars = 10 μm.

