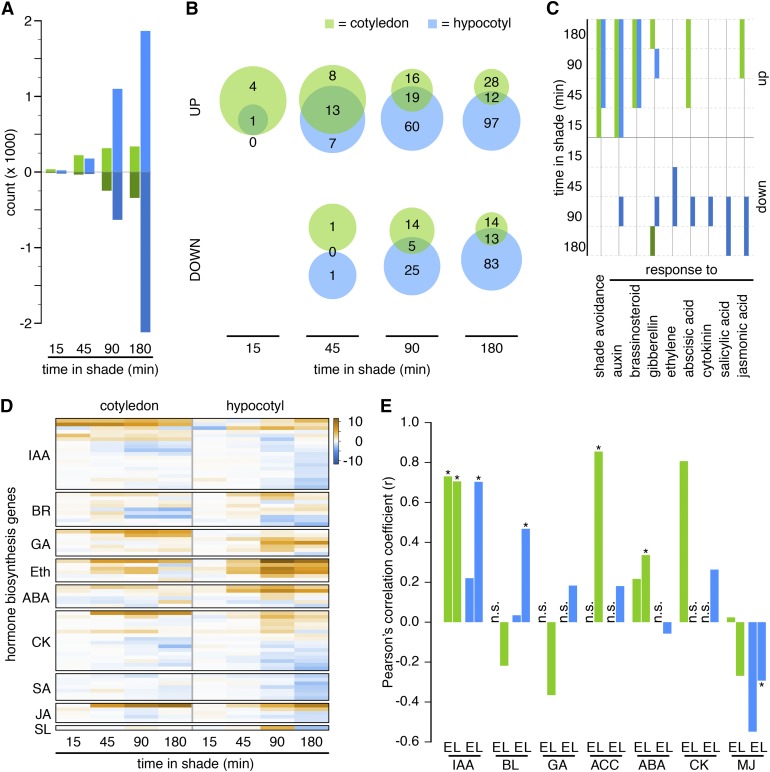
Figure 2.
Regulation of Transcript Abundance Becomes More Organ Specific with Time.
(A) Number of significantly up- or downregulated genes in cotyledons and hypocotyls over time.
(B) Set analyses of enriched GO terms between organs at various time points.
(C) Absent/present analysis of selected GO terms. Solid boxes represent significant detection (weight ≤ 0.05). Green shades = cotyledon; blue shades = hypocotyl.
(D) Hierarchically clustered log fold change of shade-regulated genes involved in hormone biosynthetic pathways.
(E) Correlation analysis of the transcriptional responses to shade and hormone treatments (Goda et al., 2008). For each hormone and organ, an early time point comparing 45 min in shade and 60 min of hormone treatment (marked with E) and a late time point comparing 3 h of treatment in both experiments (marked with L) were investigated. n.s., not significantly overlapping gene lists (hypergeometric test: P < 2.5 × 10⁻⁴); asterisks indicate P < 0.05 for the correlation coefficient. Eth, ethylene; SL, strigolactone.

