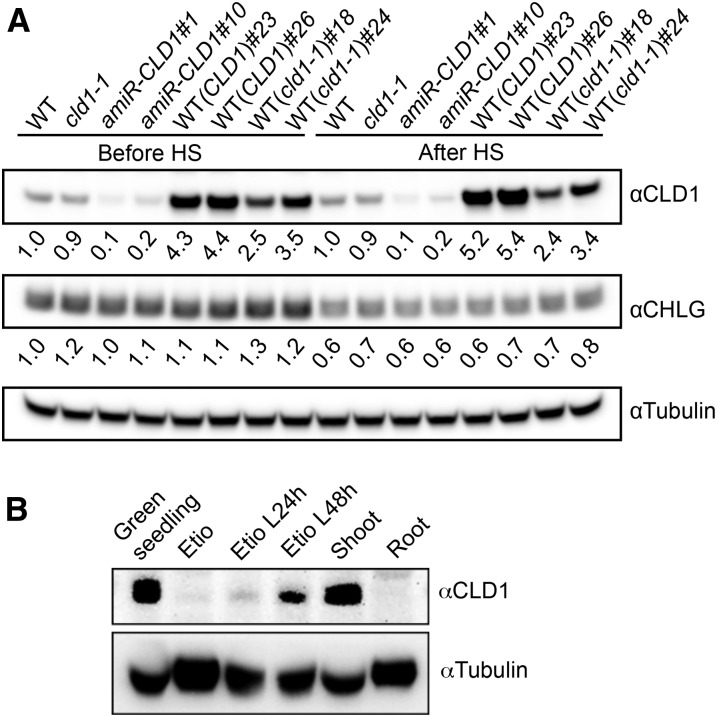
Figure 3.
Immunoblot Analysis of CLD1 Protein.
(A) Immunoblots of CLD1 and CHLG in the total proteins extracted from 5-d-old seedlings before and after treatment at 40°C for 1 h. The band intensities of CLD1 and CHLG in each sample were quantified with ImageJ software and normalized to that of tubulin, which serves as the loading control. The normalized CLD1 and CHLG band intensities in each sample were divided by the corresponding values in the wild type and shown underneath each band. amiR-CLD1#1 and #10 are independent transgenic lines expressing artificial microRNA targeting CLD1. Other line designations are described in Figure 1.
(B) Immunoblots of total proteins extracted from the shoot and root, whole 5-d-old green seedlings, or 4-d-old etiolated seedlings (Etio) without or with illumination for 24 or 48 h (L24 h, L48 h). In each lane, 70 μg of protein was loaded.

