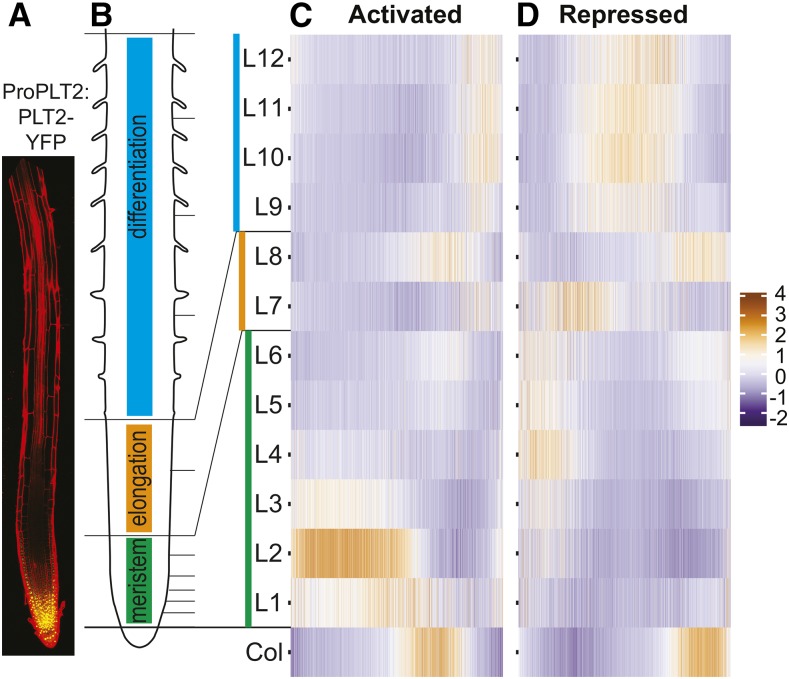
Figure 2.
PLT Guides Large-Scale Region-Specific Transcriptional Activation and Repression.
(A) Root showing gradient expression of ProPLT2:PLT2-YFP.
(B) Schematic of a root depicting developmental zones in color. Horizontal lines correspond to sections (L1-L12) of the longitudinal Root Gene Expression Atlas (Brady et al., 2007). The root in (A) is aligned to largely match zones and sections in (B).
(C) and (D) Expression profile (z-score) of genes (x axis) activated (C) or repressed (D) by at least one PLT in longitudinal sections according to the Root Gene Expression Atlas (Brady et al., 2007) (Supplemental Data Set 1). Col tissue consists of both dividing and differentiating cells.

