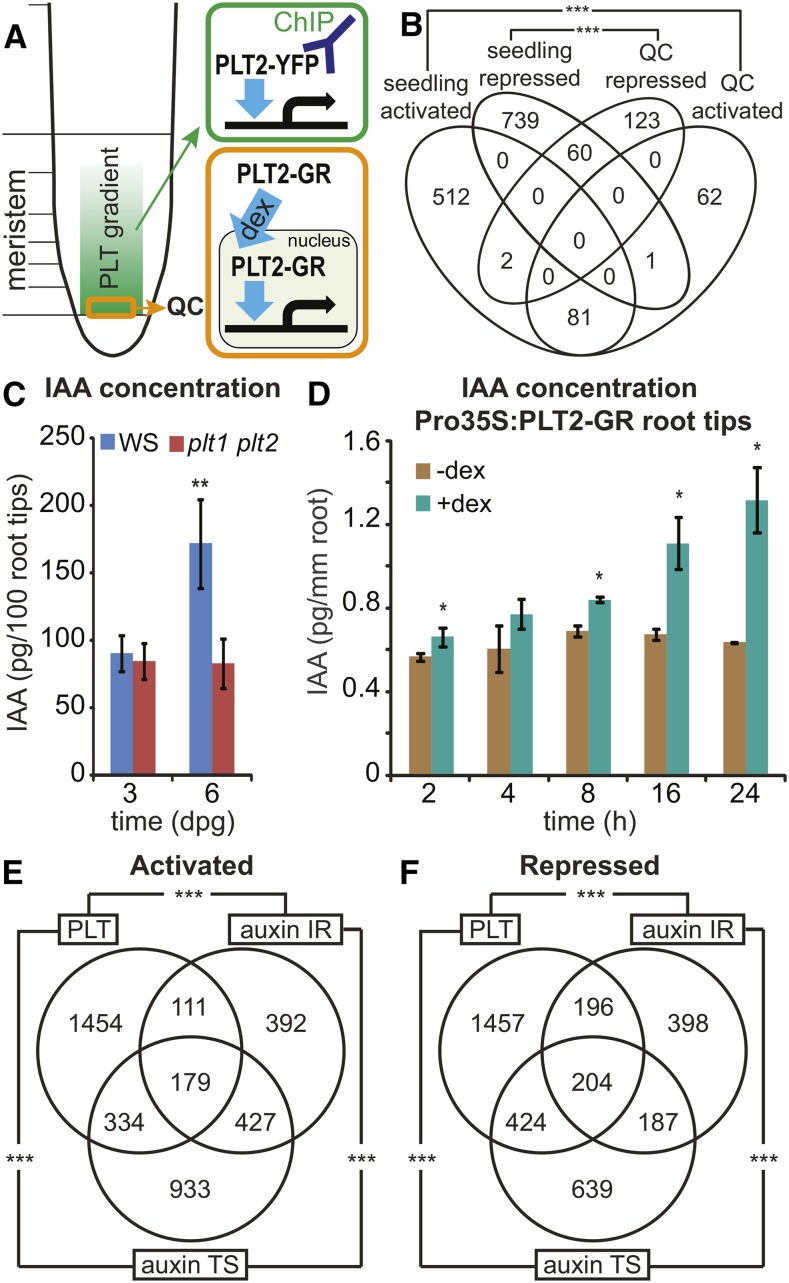
Figure 3.
PLT2 Regulates Auxin Biosynthesis and Response Genes.
(A) Schematic overview of PLT2-YFP ChIP-seq (green) and PLT2-GR regulated QC transcriptomics (orange) experiments.
(B) Venn diagram showing the overlap among regulated genes obtained from seedlings upon induced Pro35S:PLT2-GR overexpression and regulated genes from QC upon physiological complementation of plt1 plt2 by induction of ProPLT2:PLT2-GR (Supplemental Data Set 1). Regulated genes from 1 and 4 h DEX time points were pooled for the QC data set. Activated genes, ***P < 1.1 × 10−85; repressed genes, ***P < 3 × 10−38; Fisher’s exact test.
(C) IAA levels in root tips (2 mm) at 3 and 6 d after germination in wild-type (Ws) and plt1 plt2 double mutant plants. Samples were measured in quintuples. **P < 0.0008, Student’s t test. Error bars indicate sd.
(D) IAA levels in 6-d-old Pro35S:PLT2-GR root tips (2 mm) after 2, 4, 8, 16, and 24 h mock treatment compared with DEX induction. Measurements were performed in triplicate per time point with 50 root tips per sample. *P < 0.05, Student’s t test. Error bars indicate sd.
(E) and (F) Overlap between genes activated (E) and repressed (F) by PLTs and the auxin intact root (IR; Bargmann et al., 2013) and time series (TS; Lewis et al., 2013) gene sets (Supplemental Data Set 3). ***P < 2.2 × 10−55, Fisher’s exact test.

