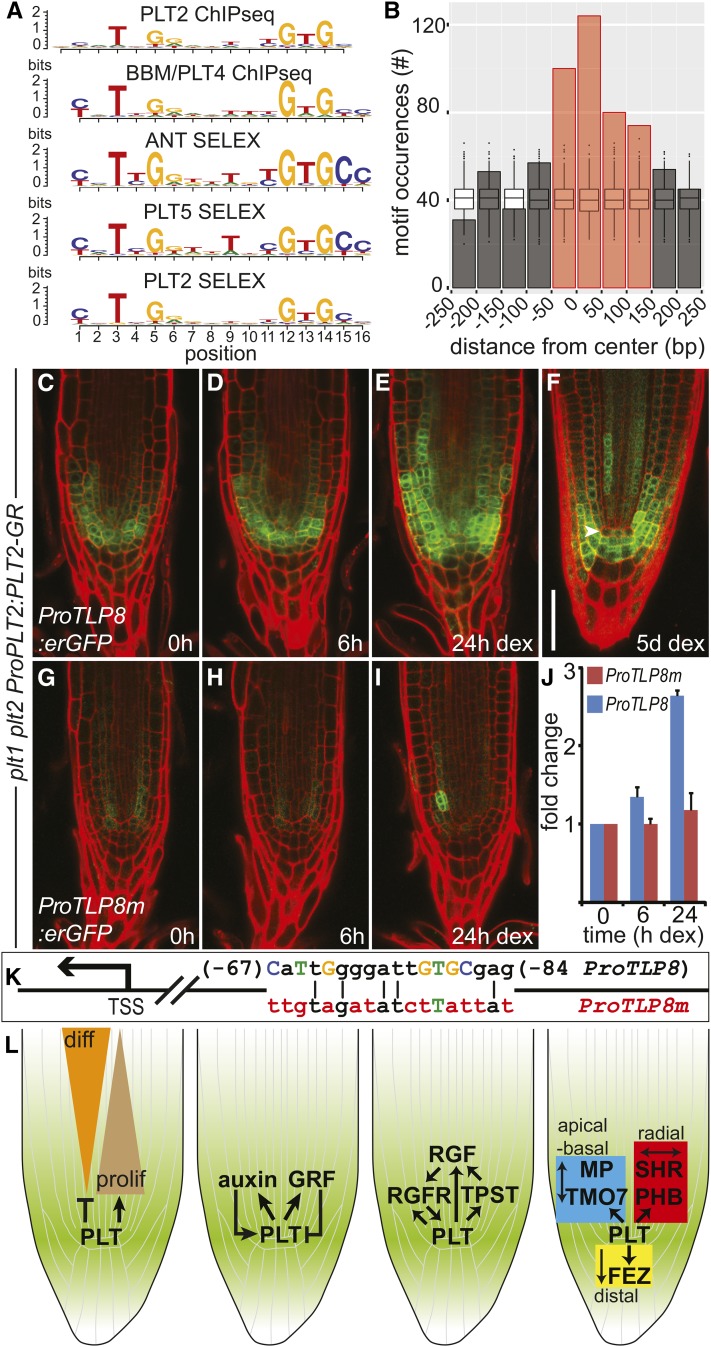
Figure 7.
PLT2 Activation of TLP8 Requires the Cognate Binding Motif Sequence.
(A) Alignment of the consensus motifs for PLT2 and BBM/PLT4 (ChIP-seq), and for ANT, PLT5, and PLT2 (SELEX). The y axis refers to the information content per motif position, measured in bits. See also Supplemental Data Set 6.
(B) PLT2 peaks assigned to regulated genes show enrichment for PLT2 motif occurrences compared with random genomic regions, and motifs were preferentially located close to the peak summit. PLT2 motif occurrences in PLT2 peaks were counted relative to peak summit positions. A region of 500 bp centered at the peak summit and divided into 50-bp bins is depicted. Box plots display the distribution of motif occurrences considering random selections of 500-bp genomic regions. Red bars: enrichment over simulated random distribution, FDR < 5%.
(C) to (E) Induction of ProPLT2:PLT2-GR (0, 6, and 24 h DEX) in 5-d-old plt1 plt2 mutant roots activates ProTLP8:erGFP expression. Experiments were repeated 12 times.
(F) Expression pattern of ProTLP8:erGFP in a plt1 plt2 ProPLT2:PLT2-GR seedling root germinated on DEX.
(G) to (I) Mutation of the PLT2 binding site in the TLP8 promoter (ProTLP8m; see [K]) dramatically affects promoter activation by DEX induction of ProPLT2:PLT2-GR (0, 6, and 24 h DEX) in 5-d-old plt1 plt2 mutant roots. Experiments were repeated six times.
(J) Expression of GFP quantified in roots of two representative independent ProTLP8:erGFP and ProTLP8m:erGFP transformants in a plt1 plt2 ProPLT2:PLT2-GR background. Expression is plotted in fold change of GFP levels relative to the uninduced (0 h) situation. Error bar indicates sd.
(K) Schematic representation of the TLP8 promoter (ProTLP8) depicting consensus bases of the PLT2 binding motif in capitalized and colored letters. Red colored bases indicate mutated bases in ProTLP8m. Numbers indicate position relative to the TSS.
(L) PLT target genes regulate differentiation progression, regulatory feedback on PLT levels and patterning (Supplemental Table 1). Bar = 50 μm.

