Figure 1.
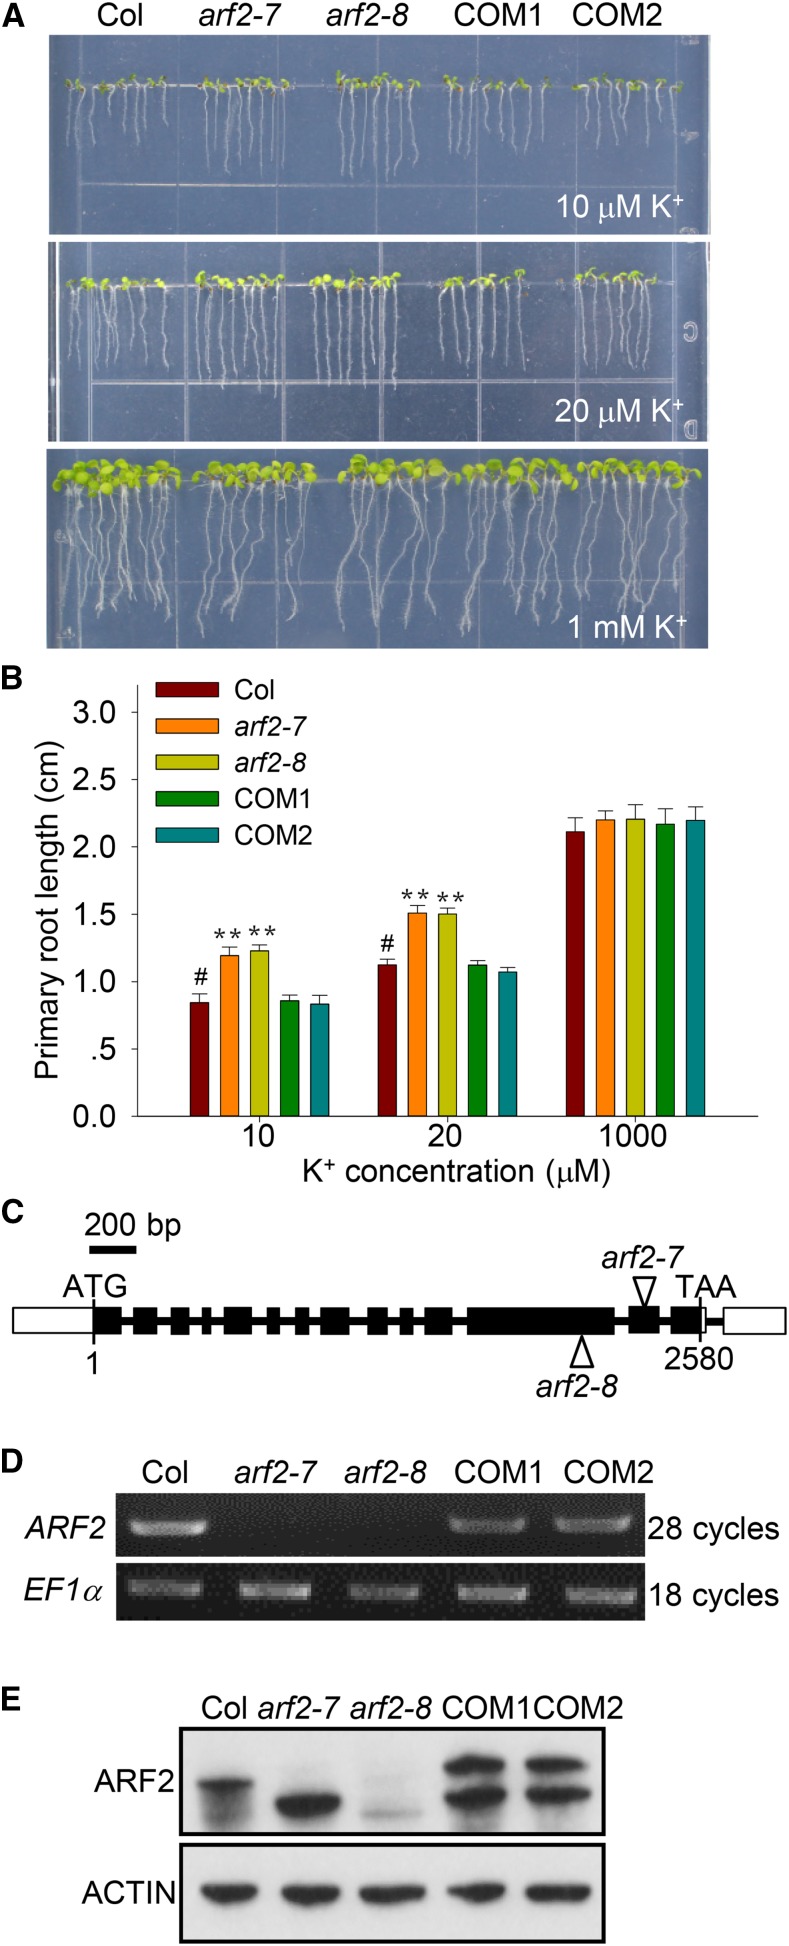
The arf2 Mutant Is Tolerant to Low-K+ Stress.
(A) Phenotype comparison among the wild type (Col), arf2 mutants (arf2-7 and arf2-8), and complementation lines arf2-7/ProARF2:ARF2-Flag (COM1 and COM2). Seedlings were germinated and grown on low-K+ (10 and 20 μM) medium or K+-sufficient (1 mM) medium for 7 d.
(B) Primary root length of various plants tested in (A). Data are means ± se (n = 15). Student’s t test (**P < 0.01) was used to analyze statistical significance, and “#” represents control.
(C) Diagram of ARF2. Filled boxes and lines represent exons and introns, respectively. Triangles indicate the T-DNA insertion sites in arf2-7 and arf2-8.
(D) RT-PCR analyses of ARF2 expression in various plants. EF1α was used as a control.
(E) Immunoblot analyses of ARF2 protein levels in various plants. ACTIN was used as a control.

