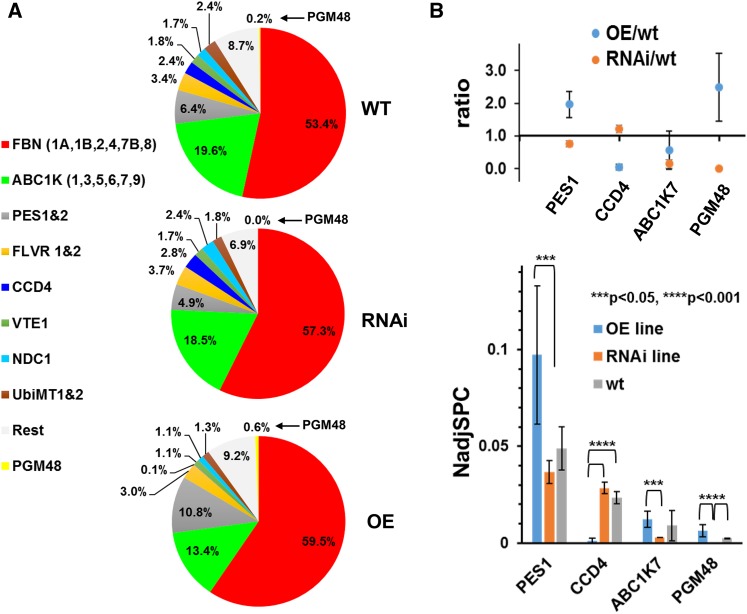
Figure 7.
PG Proteome Composition in Wild-Type, OE, and RNAi Plants during Natural Leaf Senescence Determined by MS/MS-Based Label-Free Spectral Counting of Isolated PG.
(A) Relative mass abundance of PG core proteins and protein families normalized to the abundance of the sum of all observed PG proteins. Twenty-eight PG core proteins were observed. Proteomics data are listed in Supplemental Data Set 2, and spectral data are available at ProteomeXchange (see Methods). PGs were isolated from 35-d-old rosettes of wild-type, OE-1, OE-2, RNAi-1, and RNAi-2 (plants were grown under long-day conditions at 18 h light/6 h dark) and analyzed by MS. PG proteins were determined by label-free quantitative comparative proteomics. PGM48 was not identified in the RNAi lines. The analysis was performed with three sets of independent biological replicates with two replicates for OE-1 and RNAi-1 and one replicate for each OE-2 and RNAi-2 (Supplemental Data Set 2).
(B) Statistically significant pairwise differences of normalized abundance levels (using NadjSPC) for PG core proteins across the three genotypes were determined by Student’s t test. PES1, CCD4, ABC1K7, and PGM48 showed significant pairwise differences (P < 0.05 or P < 0.01) as indicated in the bar diagram. Protein abundances were quantified based on the number of matched adjusted MS/MS spectra (NadjSPC). Data shown here are average of three independent replicate, and bars indicate standard deviations (n = 3). Abundance ratios between OE/wild-type and RNAi/wild-type of PES1, CCD4, ABC1K7, and PGM48 are shown in the upper panel.

