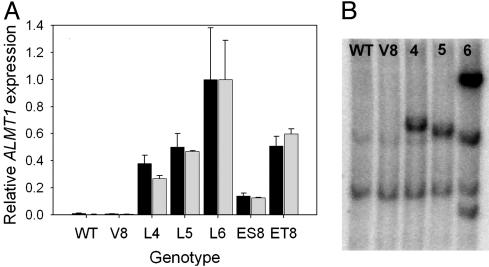
Fig. 1.
Expression of ALMT1 in primary transformants of barley. (A) Real-time quantitative RT-PCR was used to assess ALMT1 expression in root apices of three independent transgenic barley lines (lines 4-6, denoted by L4-L6) transformed with the ALMT1 coding region and the near-isogenic wheat lines ET8/ES8 that differ in Al tolerance (13). The controls consisted of nontransformed WT plants and plants transformed with the empty vector (V8). Expression is expressed relative to phosphate transporter (black columns) or proton-pump (gray columns) control genes and is shown as a proportion of the highest expressing transgenic line (arbitrarily set to 1.0). The error bars show ±SEM (n = 3). (B) Southern blot analysis of the transgenic barley lines expressing ALMT1 (lanes 4-6) and control plants (WT, wild type; V8, plasmid control). Genomic DNA was digested with HindIII, and the filter was probed with the ALMT1 coding region.

