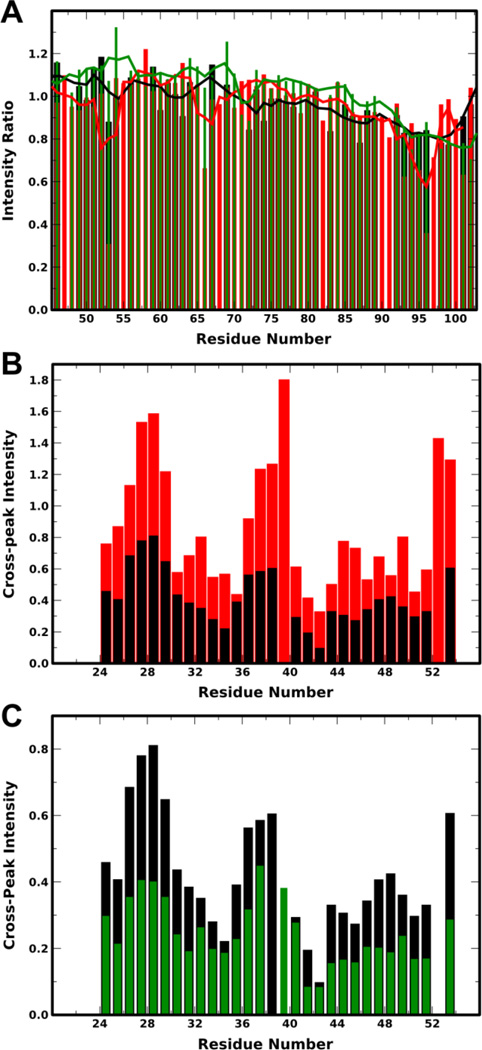
Figure 2. Determination of helical conformation of pY39 aSyn on SDS micelles.
A: Plot of ratio of peak intensity of spin-labeled to unlabeled S9C aSyn 1–102 for unphosphorylated (black), pY39 (red) and Y39E (green) protein in the presence of SDS micelles versus residue number. Lower peak intensity ratios represent a PRE effect that arises from proximity to the spin-label. For clarity, data are shown only for residues 46–102 because the expected long-range PRE effects occur around position 95. A complete plot is provided in Fig. S7A. Note that some signals could be resolved for one protein variant, but not for others, thus not each residue has data for all three variants. B: Plot of average sequential NH-NH NOE intensities for WT aSyn (black) and pY39 (red) aSyn in the presence of SDS micelles versus residue number. C: Plot of average sequential NH-NH NOE intensities for WT aSyn (black) and aSyn Y39E (green) in the presence of SDS micelles versus residue number. For panels B and C, only residues 24–54, containing the linker region, were analyzed; sequential NH-NH NOEs indicate helical or compact structure; positions with no plotted intensity are due to spectral overlap or difficulty isolating peaks.

