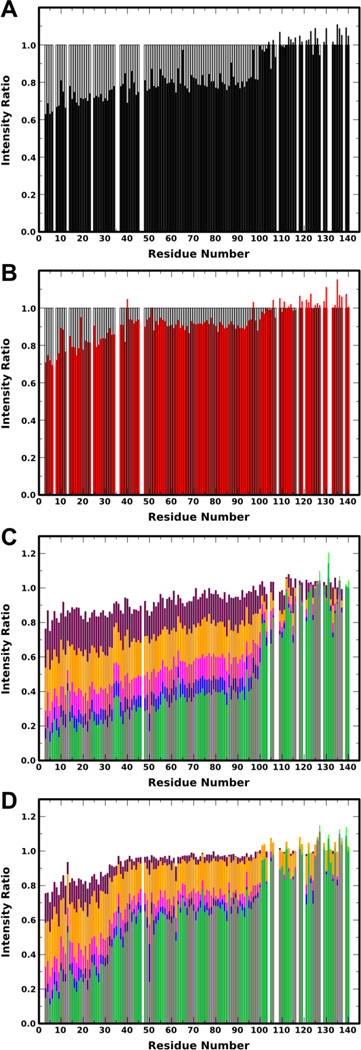
Figure 3. NMR analysis of the effect of Y39 phosphorylation on aSyn binding to lipid vesicles.
A,B: Plots of ratio of peak intensities of protein in the presence of 3 mM 15% DOPS/25% DOPE/60% DOPC SUVs to protein without SUVs for unphosphorylated (black, A)and pY39 (red, B) aSyn Y125F/Y133F versus residue number. Grey bars indicate which peaks were analyzed and lower intensity ratio reflects a greater population of protein with that region bound. C,D: Plot of ratio of peak intensity of protein in the presence of 1.5 (maroon), 3 (orange), 6 (magenta), 9 (blue), and 12 (light green) mM 15% DOPS/25% DOPE/60% DOPC SUVs to protein without SUVs for WT (C) and Y39E (D) aSyn versus residue number. Lower intensity ratio reflects a greater population of protein with that region bound.

