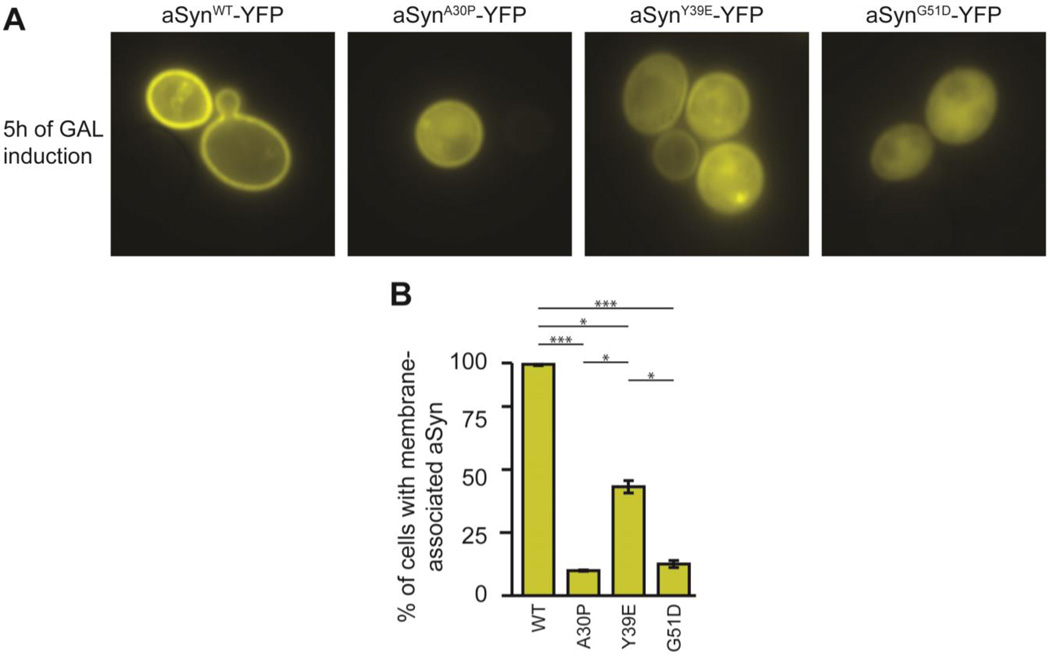
Figure 4. Membrane localization of aSyn y39E in yeast.
A: Representative fluorescence microscopy images of yeast overexpressing YFP fusions of aSyn WT, A30P, Y39E, and G51D after 5 hours of induction. B: Percentage of cells with membrane-associated aSyn. Values are the mean ± SEM of 3 independent experiments of 5 random fields each; * and *** represent P-values < 0.05 and 0.001, respectively.

