
Fig. 1.
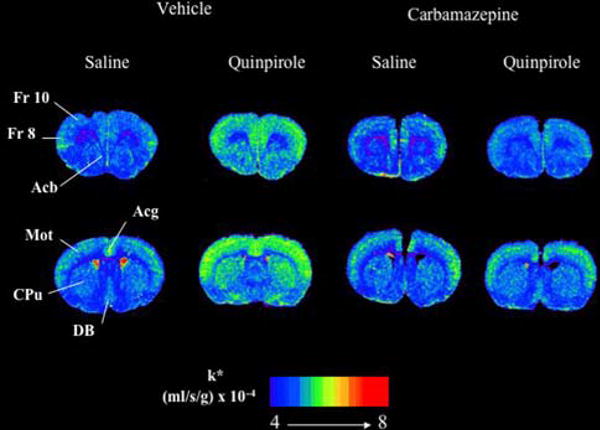
Coronal autoradiographs of brains showing effects of quinpirole and carbamazepine on regional AA incorporation coefficients k* in rats. Values of k* (ml/s/g brain × 10−4) are given on a color scale from 4 (blue) to 8 (yellow-orange). Abbreviations: Acb, nucleus accumbens; Acg, anterior cingulate cortex; CPu, caudate-putamen; DB, diagonal band; Fr 8, frontal cortex area 8; Fr 10, frontal cortex area 10; Mot, motor cortex. Note: For interpretation of the references to color in this figure legend, the reader is referred to the online version of this article