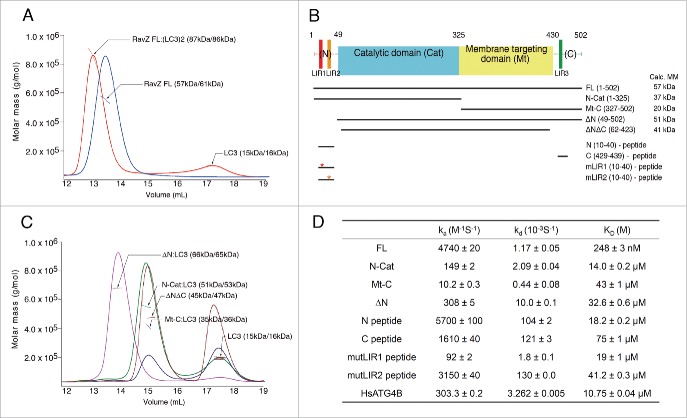
Figure 1.
Interaction between RavZ and LC3. (A) The RavZ-LC3 complex (red line) and RavZ alone (blue line) analyzed by SEC-MALS. The horizontal line represents the measured MM. Each species is indicated by an arrow with experimental (MALS) and theoretically calculated (Calc) molar mass values shown in parentheses (MALS/Calc). This shows the 1:2 binding stoichiometry between RavZ and LC3. (B) Domain architecture and RavZ constructs in this study. Three potential LIR motifs in the primary sequence are numbered sequentially: LIR1, LIR2 and LIR3. The abbreviations of each construct and the calculated molecular weights are shown. (C) The SEC-MALS results with deletion mutants of RavZ in the presence of LC3. ΔN (magenta line), N-Cat (green line) and Mt-C (blue line) in the presence of LC3 elute earlier and their MMs determined by SEC-MALS are 15-kDa greater than the calculated MMs of the free mutants, indicating 1:1 complex formation. The ΔNΔC mutant comprising deletion of the flexible N- and C-terminal regions (brown line) is unable to form a complex with LC3. Excess LC3 with MM of 15 kDa elutes later. (D) Summary of SPR data. The binding of RavZ and its deletion mutants to immobilized LC3 was measured, and the binding of ATG4B was also measured as a test case (See Fig. S1A and S2 for the SPR sensorgrams). The equilibrium dissociation constant (KD) was obtained by dividing the dissociation rate constant (kd) by the association rate constant (ka).

