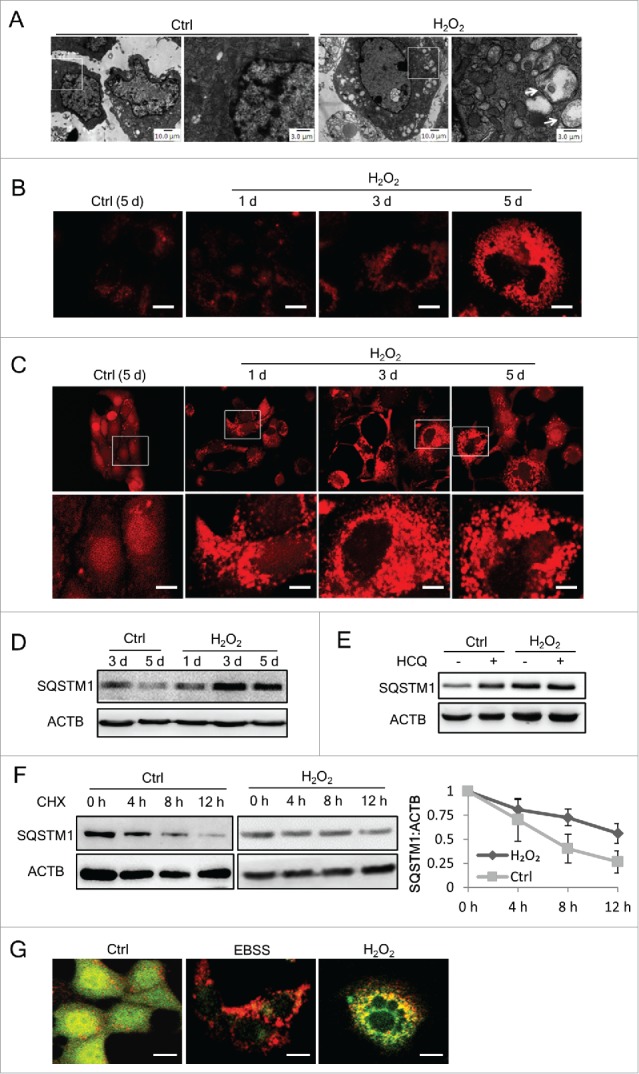
Figure 2.

Autophagic structures increase but autophagic flux is impaired in senescent cells. (A) Transmission electronic microscopy of control or H2O2-treated NIH3T3 cells at day 5. The amplified image on the right of each group is selected from the rectangle area of the left image. Arrows show the vesicle-like structures. (B) The lysosome content of NIH3T3 cells was probed with LysoTracker Red DND-99 and images were taken under a fluorescence microscope by the same exposure parameters. Scale bars: 10 μm. (C) Fluorescence images of mRFP-LC3 NIH3T3 cells treated with H2O2 at the indicated time points. Scale bars: 20 μm. Lower panel shows the amplified images of those in rectangles. (D) NIH3T3 cell lysates were collected at the indicated time points and SQSTM1 was examined by western blots. (E) SQSTM1 in NIH3T3 cells was examined by western blots. Both control and H2O2-treated cells were in parallel treated with or without 5 μg/ml HCQ for 12 h before sample collecting. (F) Control or H2O2-treated NIH3T3 cells were cultured for 3 day before adding CHX (100 μg/ml). Samples were collected at the indicated time points after CHX addition, and SQSTM1 was examined by western blot. Representative images are shown at the left, and statistical data calculated from 4 independent experiments are shown at the right. (G) Fluorescence images of mRFP-GFP-LC3 in NIH3T3 cells starved with EBSS for 12 h or at day 3 after H2O2treatment. Scale bars: 10 μm.
