
Figure 3.
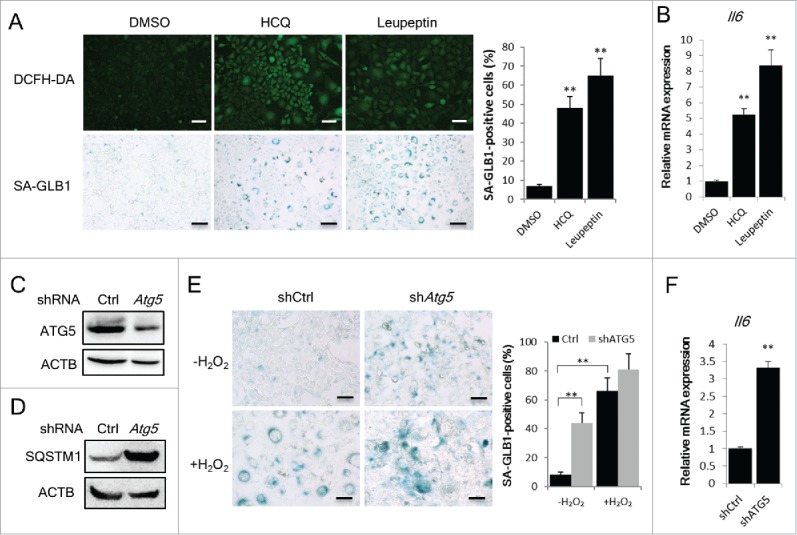
Blockage of autophagy flux is sufficient to induce cellular senescence. (A) NIH3T3 cells were treated with HCQ (3 μg/ml) or leupeptin (5 μg/ml) for 7 d. DCFH-DA fluorescence and SA-GLB1 staining was used to detect intracellular ROS (upper panel) and the senescent state (lower panel) of these cells. The percentages of SA-GLB1-positive cells were quantified. Scale bars: 50 μm. (B) Relative Il6 mRNA expression of the cells treated as described in (A) were quantified by qRT-PCR. (C) and (D) NIH3T3 cells transfected with control shRNA or Atg5 shRNA and positive cells were selected with 2 μg/ml puromycin for 7 d. Images of western blots for ATG5 (C) and SQSTM1 (D) are shown. (E) The cells described in (C) were cultured for another 5 d, and then treated with H2O2 followed by a 3-d incubation. Images of SA-GLB1 staining and the percentages of SA-GLB1-positive cells are shown. Scale bars: 20 μm. (F) Relative Il6 mRNA level in cells cultured for 15 d were quantified by qRT-PCR. The data are presented as means ± SD from 3 independent experiments and **p < 0.01.