
Figure 4.
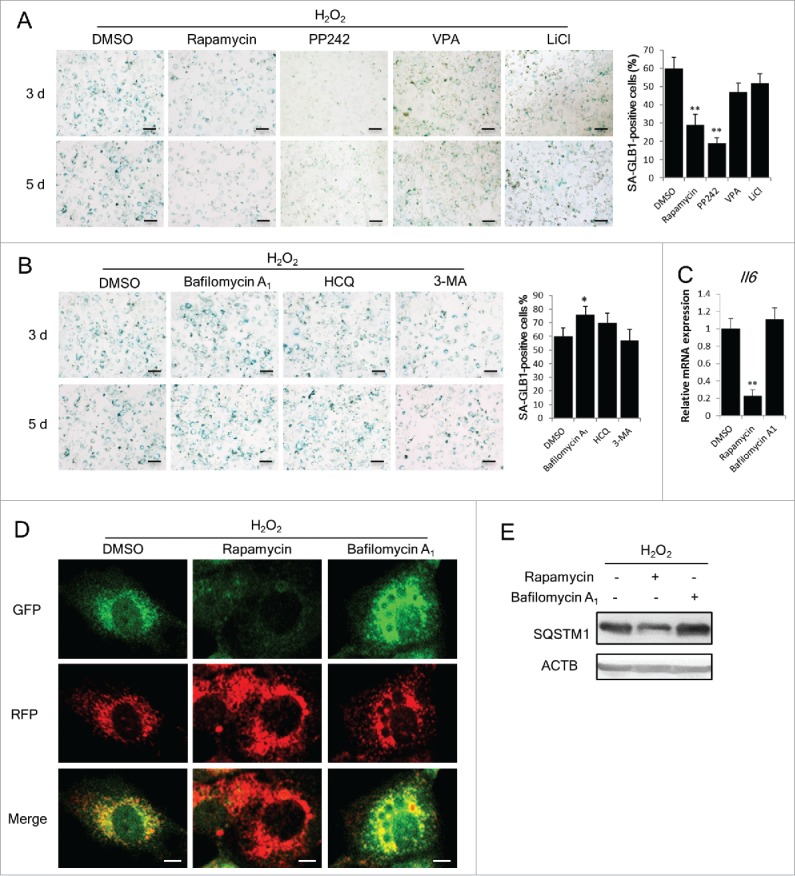
Autophagy restoration attenuates SIPS development. (A) and (B) NIH3T3 cells treated with or without H2O2 were incubated with the indicated reagents for 3 or 5 d. Autophagy activators rapamycin (100 nM), PP242 (500 nM), VPA (1 mM) and LiCl (10 mM) were applied in (A) and autophagy inhibitors bafilomycin A1 (50 nM), HCQ (3 μg/ml) and 3-MA (500 μM), were applied in (B). Images of SA-GLB1 staining are shown in the left, and the percentages of SA-GLB1-positive cells at day 5 are shown in the right. Scale bars: 50 μm. (C) Relative Il6 mRNA level in H2O2-treated NIH3T3 cells was measured by qRT-PCR. (D) Confocal images of cells stably expressing mRFP-GFP-LC3. Scale bars: 5 μm. (E) SQSTM1 in H2O2-treated NIH3T3 cells at d 3 were examined by western blots. The data are presented as means ± SD from 3 independent experiments. *p < 0.05 and **p < 0.01 when compared to DMSO.