
Figure 5.
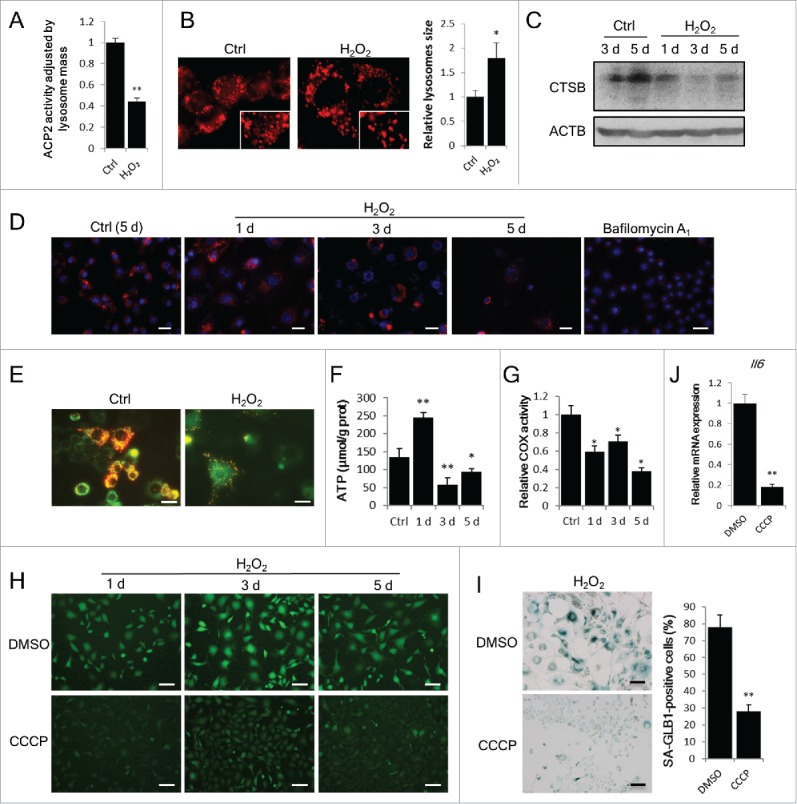
Autophagy impairment couples with lysosomal and mitochondrial dysfunction. NIH3T3 cells were treated with or without H2O2. (A) In vitro ACP2/acid phosphatase activity assay was performed at d 3 after H2O2 treatment. (B) Lysosomes in cells were probed with LysoTracker Red DND-99 at day 3 and images were taken by confocal microscopy. The images in rectangles are 1.5-fold enlarged. Relative lysosome size in control and H2O2-treated cells was quantified. (C) CTSB in control and H2O2-treated cells at the indicated time points were examined by western blot. (D) Cellular CTSB activity was visualized by using the Magic Red Cathepsin B detection kit at the indicated days. Cells treated with bafilomycin A1 (50 nM) for 12 h are shown as a negative control. Scale bars: 50 μm. (E) Mitochondrial membrane potential in cells was measured by JC-1 staining at d 3. Scale bars: 20 μm. (F) Cellular ATP level of control (5 d) and H2O2-treated (1 d, 3 d, 5 d) cells was measured. (G) Mitochondrial COX activity of control (5 d) or H2O2-treated (1 d, 3 d, 5 d) cells was assayed. (H) Cells pretreated with DMSO or 10 μM CCCP for 6 h followed by H2O2 treatment as described in the Materials and Methods. Images of DCFH-DA fluorescence was taken at the indicated days. Scale bars: 50 μm. (I) SA-GLB1 staining was performed at day 5 on CCCP-pretreated cells. Scale bars: 50 μm. (J) Relative Il6 mRNA expression of CCCP-pretreated cells at d 5. The data are presented as means ± SD from 3 independent experiments. *p < 0.05 and **p < 0.01 when compared to control or DMSO.