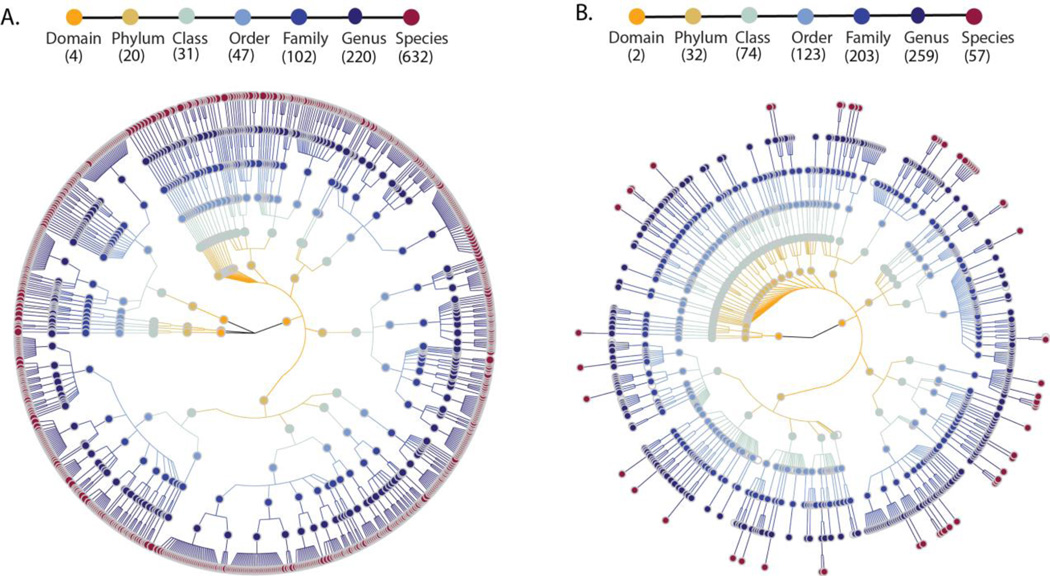
Fig. 1. The taxonomic tree of microbial taxonomies predicted by MGS and 16S rRNA gene sequencing.
(A) Taxonomic tree based on MGS shotgun sequencing data. (B) Taxonomic tree based on16S rRNA gene sequencing data. Each dot represents a taxonomic entity. From the inner to outer circles, the taxonomic levels range from domains to species. Different colors of dots indicate different taxonomy levels according to the color key shown. Numbers in brackets indicate the total number of unique taxonomies detected at each level.

