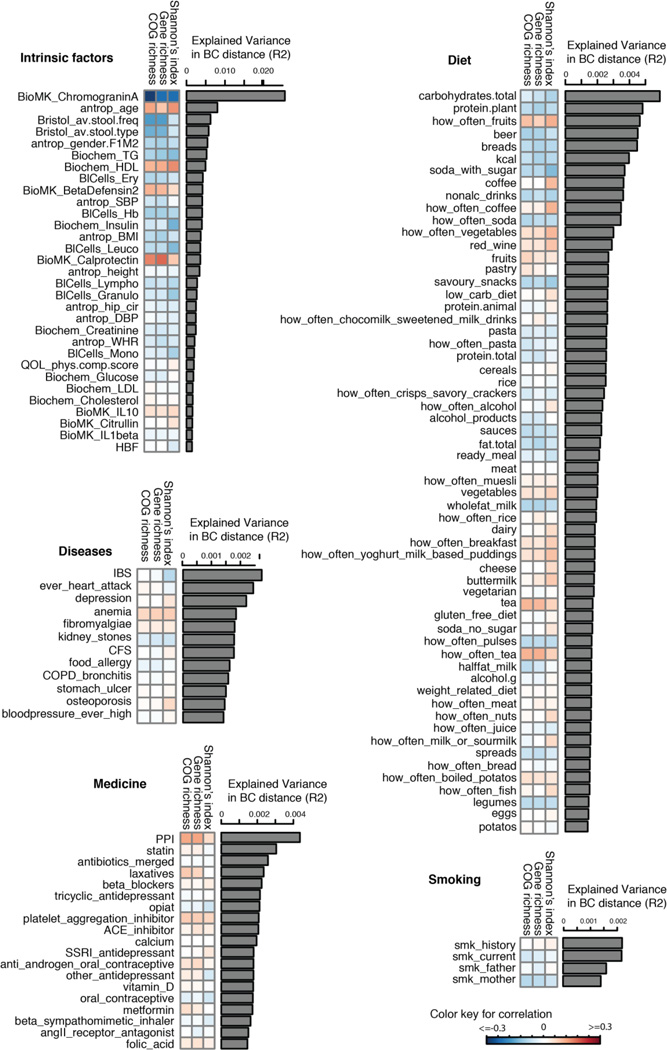
Fig. 3. Factors associated with inter-individual variation of gut microbiome.
A total of 126 factors (FDR<0.1) were associated with inter-individual variation of the gut microbiome. The bar plot indicates the explained variation of each factor in the inter-individual variation of microbial composition (Bray-Curtis distance). The heatmap under the bar plot shows the correlation coefficients of each factor with Shannon’s index of diversity, gene richness, and COG richness, respectively. Color key for correlation is shown.

