
Fig 5. Theoretical predictions of power per causal SNP, for total sample size (x-axis) and CGR between two sets of studies (y-axis).
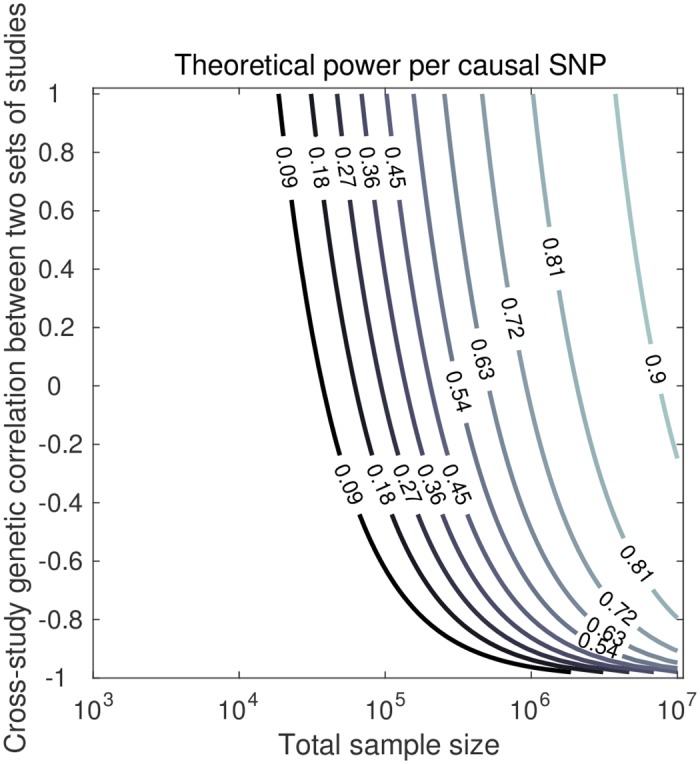
Factor levels: 2 sets of 50 studies, CGR equal to 1 within both sets, 100k independent SNPs, and arising from a subset of 1k independent SNPs.