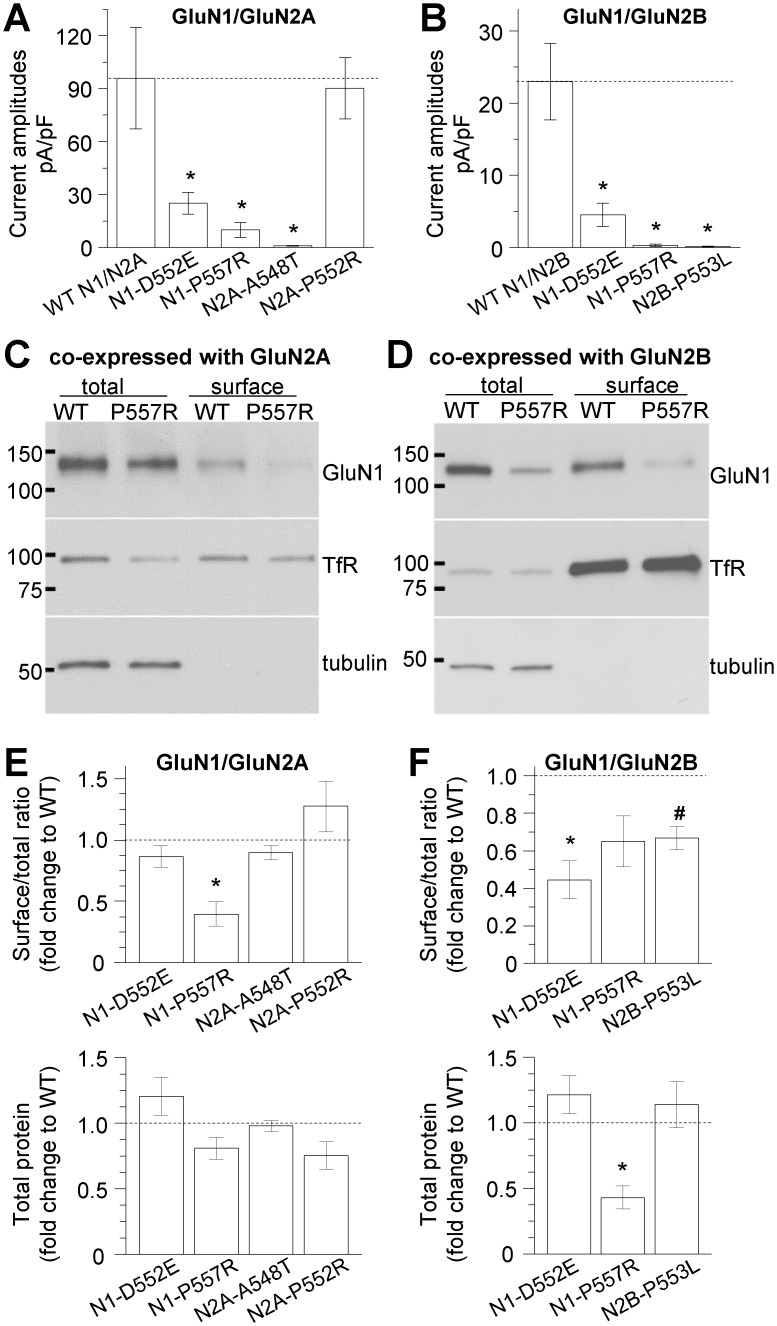
Fig 3. Pre-M1 mutations affect current amplitudes and NMDAR surface expression.
A,B, Summary of current amplitudes evoked by 1 mM glutamate and 100 μM glycine in whole cell voltage clamp recordings from HEK293 cells expressing human NMDARs (holding at -60 mV). *p < 0.05, see Table 3 and S4 Table for statistical analyses. The graph legends refer to GluN1 as N1 and GluN2 as N2. C-F, The surface proteins of HEK293 cells transiently expressing WT or mutated human NMDARs were labeled with biotin and pulled down with avidin-conjugated beads. The total and surface protein fractions were immunoblotted for GluN1, GluN2A or GluN2B, transferrin receptor (TfR), and tubulin. Representative blots are shown for HEK293 cells expressing GluN1/GluN2A and GluN1-P557R/GluN2A (C), and GluN1/GluN2B and GluN1-P557R/GluN2B (D). Chemiluminescence signals were quantified by densitometry, and the ratio of surface-to-total protein and total protein levels for each mutant were plotted as the fold-change from WT (dashed line). Total protein levels were normalized to tubulin levels. The data were analyzed by one-way ANOVA and paired t-tests between respective mutant and WT controls, with Benjamini-Hochberg correction for multiple comparisons (E, GluN1/GluN2A surface/total: F(7,28) = 5.081, p < 0.001; *p = 0.019; GluN1-D552E/GluN2A p = 0.475; 2A-A548T p = 0.453; GluN1/GluN2A-P552R p = 0.404; GluN1/GluN2A total (lower panel): F(7,28) = 2.050, p = 0.084; F, GluN1/GluN2B surface/total: F(5,28) = 7.585, p < 0.001; *p = 0.025; #p = 0.018; GluN1-P557R/GluN2B p = 0.102; GluN1/GluN2B total (lower panel): F(5,28) = 4.903, p = 0.002; *p = 0.018; GluN1-D552E/GluN2B p = 0.473; GluN1/GluN2B-P553L p = 0.649). See also S1 Fig.

