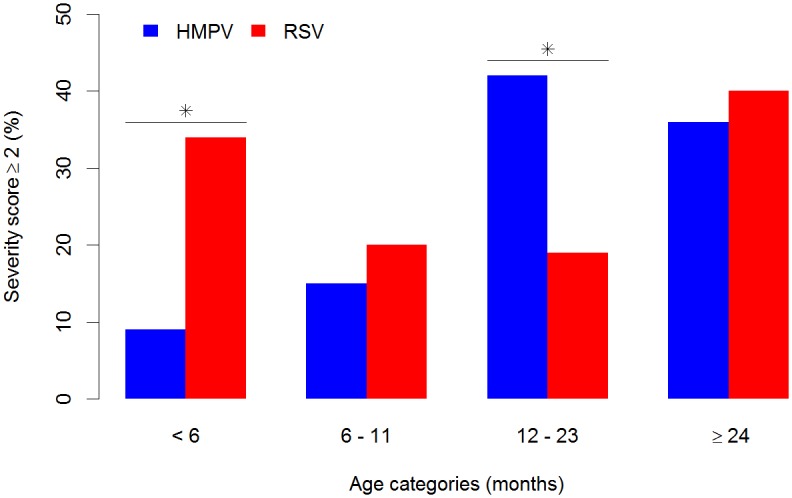
Fig 2. Proportions of children (%) with severe lower respiratory tract infection, severity score ≥ 2, among single virus-infected children with HMPV (blue) (n = 106) and RSV (red) (n = 540), according to age categories.

Asterisk indicates significant differences (P < 0.05).
