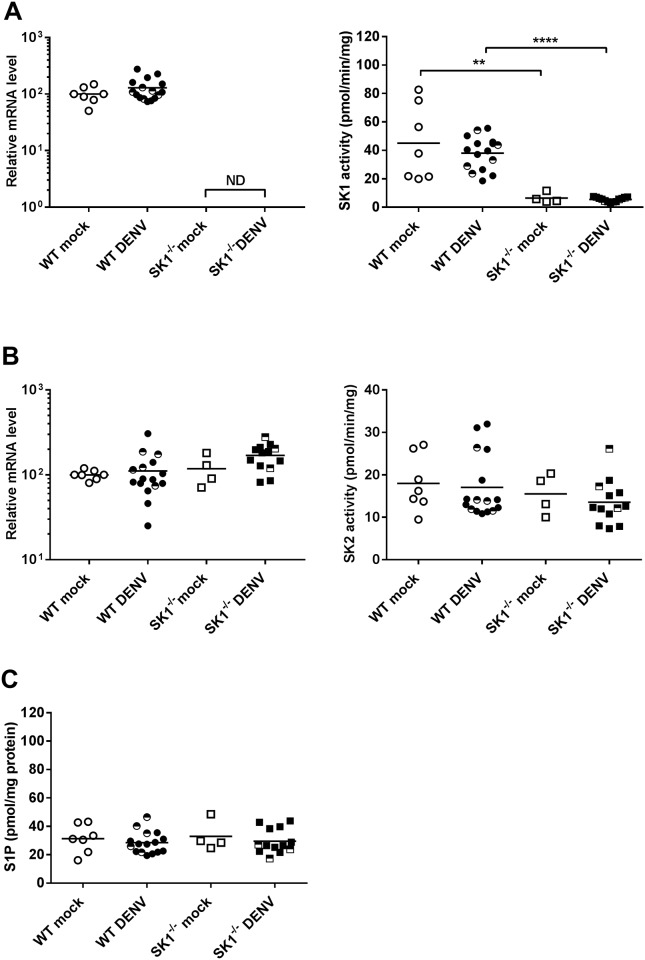
Fig 5. Definition of the SK/S1P axis in WT and SK1-/- mice following ic infection with DENV-2.
WT and SK1-/- mice were ic infected with DENV, as in Fig 1 and at end stage disease, brain tissue was harvested and snap frozen or stored in TRIzol. RNA was extracted from TRIzol and lysates prepared in EB buffer from snap frozen tissue. A. SK1 mRNA was determined by qRT-PCR (left panel) and isoenzyme specific SK1 activity assay (right panel); B. SK2 mRNA was determined by qRT-PCR (left panel) and isoenzyme specific SK2 activity assay (right panel); C. S1P was quantitated in brain lysates by HPLC. n = 11 WT and n = 10 SK1-/- DENV-infected, n = 7 WT mock and n = 4 SK1-/- mock-infected mice. PCR data represent average PCR values from individual mice and normalized against GAPDH by ΔCt method. SK activity data and S1P quantitation are expressed relative to total protein quantitation. Statistical significance was assessed by unpaired student t-test. ** = p < 0.05, **** = p < 0.00005. ND, not detected. Data points representing non-symptomatic animals (9–14 dpi) are indicated by the half-filled symbols. Statistical analysis has been performed on symptomatic DENV-infected mice only, excluding n = 5 WT and n = 3 SK1-/- at 9/14 dpi.

