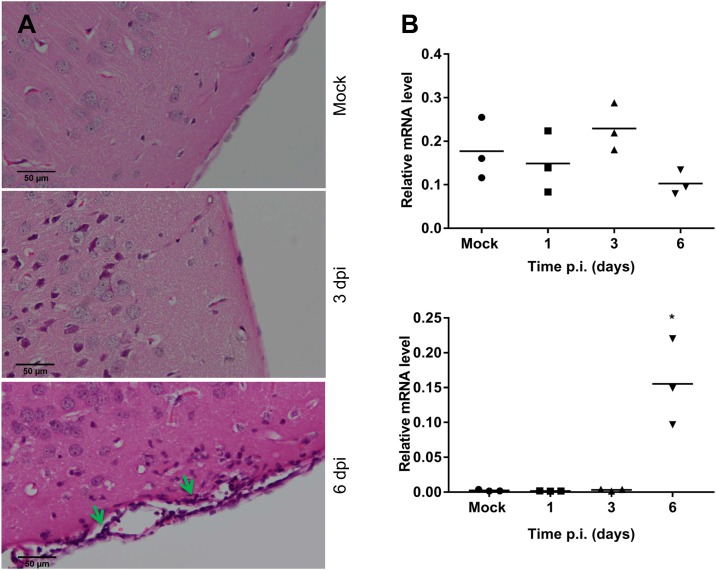
Fig 6. T-cell infiltration in the brain of WT mice following ic infection with DENV-2.
WT mice were ic infected with DENV, as in Fig 1 and brain tissue was harvested. A. at 3 and 6 dpi, tissue was fixed and processed for H&E staining. Images are representative of n = 3 mice. Arrows indicate sites of cellular infiltrate; B. at the indicated time point RNA was extracted and CD4 and CD8 mRNA determined by qRT-PCR with n = 3 mice at each time point. Data represent average PCR values from individual mice and normalized against GAPDH by ΔCt method. Statistical significance was assessed by unpaired student t-test. * = p < 0.05.

