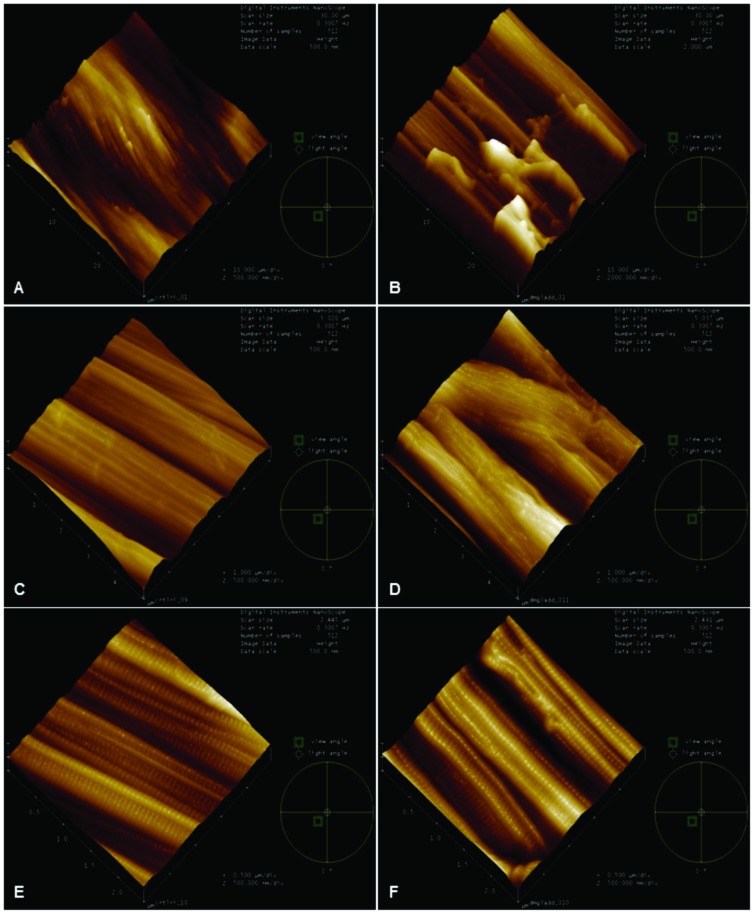
Fig 3. Characterization of surface roughness using Atomic Force Microscopy.
3D representation of the topography of the surface of the fibers and fibrils of the Control Group (A, C and E) and the Diabetic Group (B, D and F) with an area of 30 μm, 5 μm and 2.5 μm. The Control Group (A, C and E) shows nanofibers as uniaxially aligned and well organized fibers. The Diabetic Group (B, D and E), however, shows lack of a uniaxial pattern in collagen fibrillar nano-structure. Fig 3B demonstrates great irregularity of the fiber bundles with breaks in aspect of an abyss with discontinuities. Fig 3D demonstrates the morphological disorganization of the bundles, with modification of the grain direction of the bundles and jagged junctions. Fig 3F shows deformities in the form of bugles collagen fibrils.

