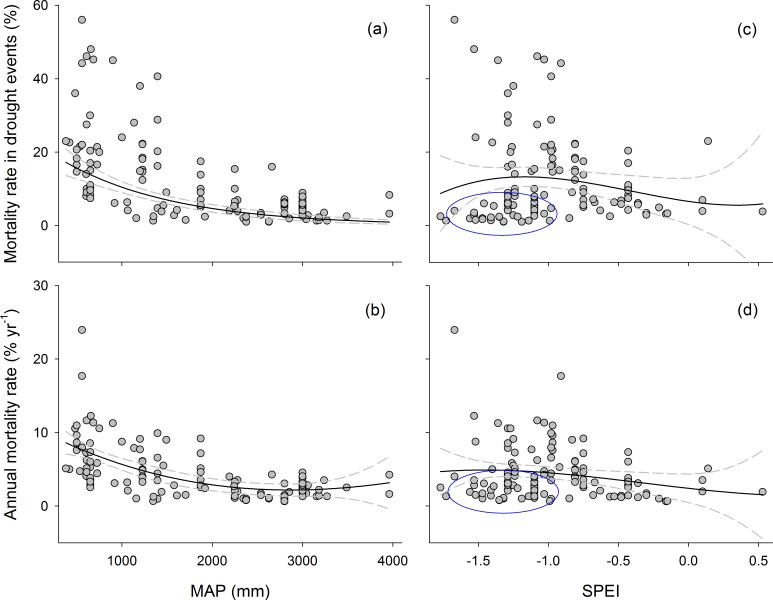
Fig 4. Sensitivity of mortality to drought for angiosperms.
(a) and (b) showed relationships between tree mortality metrics and MAP. (c) and (d) showed relationships between tree mortality metrics and SPEI. Dark-grey dots indicate droughts. Dark-grey dots indicate droughts. The best-fit models for each drought index and mortality-rate metric are shown, with the 95% bootstrapped confidence intervals. MAP, mean annual precipitation; SPEI, standardized precipitation-evapotranspiration index. The blue ovals indicate the lower tree mortality rate for tropical rainforests.

