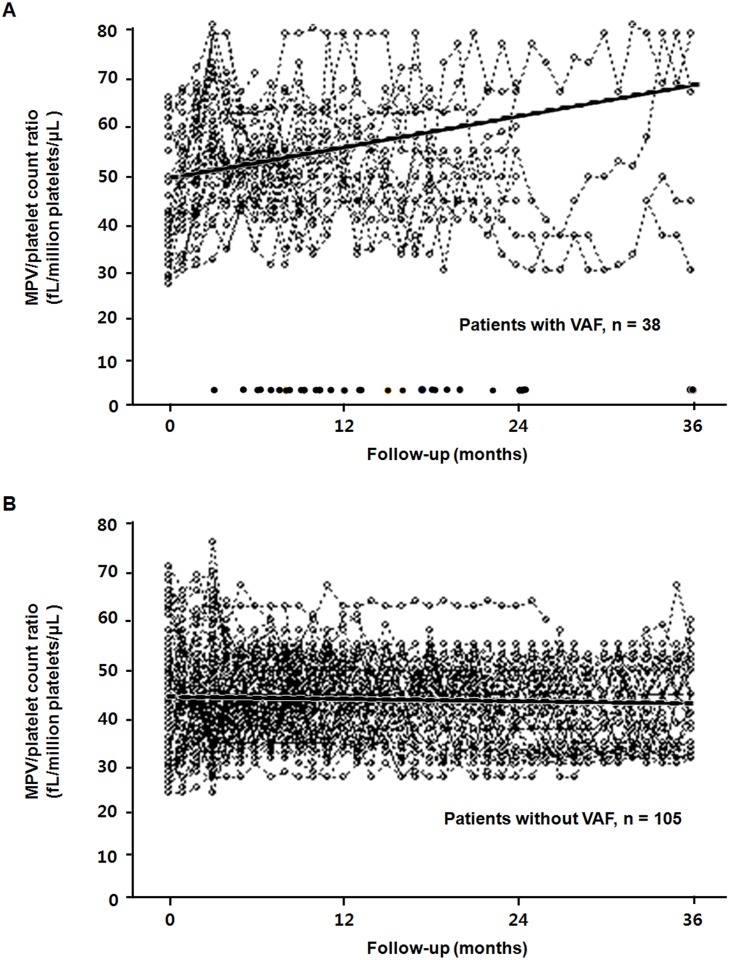
Fig 2. MPV/platelet count ratio over time in patients with VAF (A) and without VAF (B).
Dash lines represent individual patient measurements, and darker solid lines represent predicted values. The linear mixed model revealed a significantly increased MPV/platelet count ratio over time in patients with VAF (A) compared with patients without VAF (B) (P < 0.001). A row of dots along the bottom of the plot (A) showed the time points at which vascular accesses failed.

