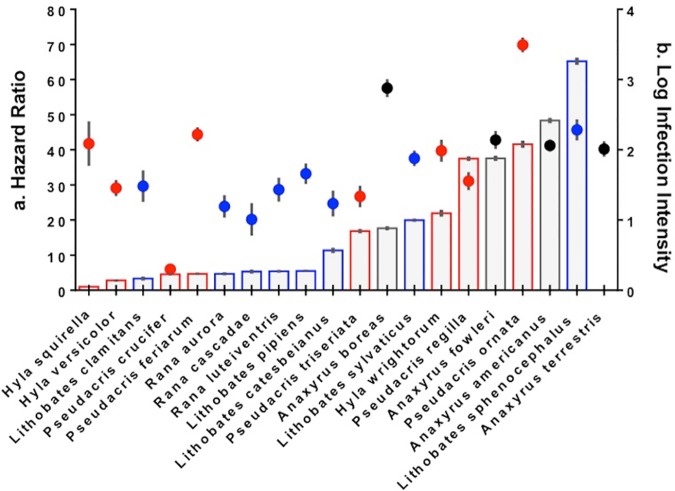
Fig 2.
(A) Hazard ratios displayed with bars and (B) average infection loads displayed with circle symbols for 20 amphibian species experimentally exposed to Batrachochytrium dendrobatidis. Hazard ratios represent the difference in risk of mortality between the Bd-exposed and control treatments. Hazard ratios > 1 indicate greater risk of mortality associated with the Bd treatment. Species are listed from lowest to highest hazard ratio from left to right and H. squirella was the only species that did not show a significant within-species treatment effect (HR = 1). Hazard ratios were obtained from Cox Proportional Hazards models that were fit without covariates, which explains why exact values differ from those previously reported [32, 38]. Infection load values represent average Bd zoospore genome equivalents detected in the skin of animals across the entire duration of the experiment (calculated as log10 (1 + average load) for each species. Error bars (on bars and points) = +/- 1 SE of the mean. Black dots and bar outlines indicate species in the family Bufonidae, red dots and bar outlines correspond to species within the family Hylidae and blue dots and bar outlines represent species in the family Ranidae.

