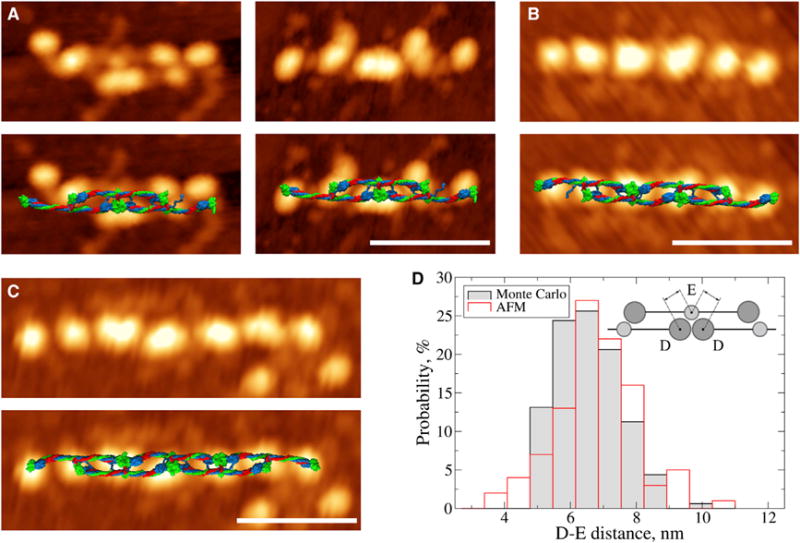
Figure 4. AFM Images and In Silico Structures of Two-Stranded Fibrin Oligomers.

(A–C) AFM images of fibrin oligomers: trimer (A), tetramer (B), and pentamer (C). The bottom row displays AFM images with in silico structures superimposed. Due to the larger flexibility of shorter oligomers, the superposition is better for the longer structures (B and C) compared with the shorter structures (A). The scale bars represent 50 nm.
(D) Histograms of the D-E distances from AFM image analysis and in silico structures obtained in step 2 (see Figure 3). The inset in (D) shows a schematic illustrating how the distance between nodules of the D and E regions was measured. See also Figure S3 for additional AFM images.
