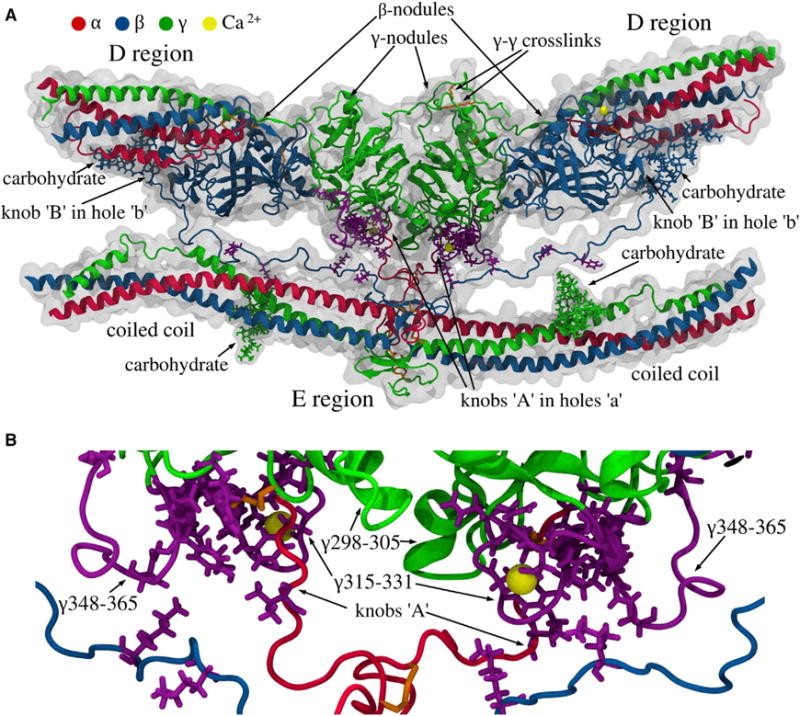
Figure 5. Structure of the D-E-D Complex.

(A) The D regions of two adjacent molecules in the upper strand with the γ- and the β-nodules, and the E region of the third fibrin molecule in the lower strand with parts of the coiled coils. Also shown are the carbohydrate chains, two pairs of knobs ‘A’ and ‘B’ in the E region of the lower molecule bound, respectively, to holes ‘a’ (in the γ-nodules) and ‘b’ (in the β-nodules) of the upper molecules, the γ-γ crosslinks, and calcium ions (see Data S3).
(B) Magnified view of the D-E-D complex with the residue contacts stabilizing the D:E interfaces. The purple side chains mark the single-point mutations in fibrinogen variants (see Table S2). The loops γTyr348-Asn365 and γTrp315-Gly331 in the γ-nodules, where most of the natural mutations occur, are shown in purple. The figure is based on MD simulations with the SASA implicit solvent model (see Supplemental Information). MD simulations of the γ-E-γ fragment in explicit solvent (see Supplemental Information) show similar results, with identical residue-residue contacts between amino acids in the γ-nodules and E region. See also Figure S4 for details of the B-b knob-hole interactions; and Data S3.
