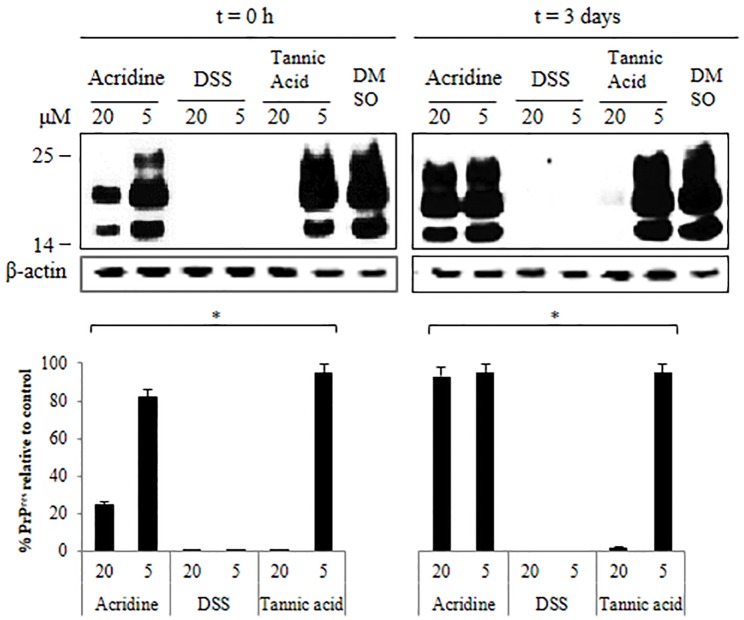
Fig 4. Western blots of PrPres in cell screening.
PrPres after cell screening with test compounds and subsequent cell lysis for western blotting. Each compound was tested in duplicate in 3 independent experiments. The relative band densities are shown as the volume intensity/mm2 relative to the β-actin band density. Each value represents the mean and standard deviation; P < 0.05 and representative blots are shown.

